The 2022 ICT Mentorship program offers an invaluable opportunity for traders to enhance their skills and deepen their understanding of the financial markets. Guided by experienced mentors, the ICT Mentorship focuses on advanced trading strategies, market structure analysis, and risk management techniques. With a focus on practical, hands-on learning, the ICT 2022 Mentorship equips traders with the tools needed to master the markets and refine their trading approach.
This blog post provides an executive summary of the first 10 episodes of the ICT Mentorship 2022 program.
Episode 2: ICT 2022 Mentorship and Homework
Below is the executive summary of Mentorship2022 2nd Episode.
Price Targets, Fair Value Gaps (FVGs), and Liquidity
When setting up trades, consider price targets and key elements such as FVGs and liquidity zones. Here’s a breakdown:

Stop Hunts and Liquidity Grabs:
- Expect stop hunts on buy stops or short-term highs when anticipating lower prices.
- Similarly, look for short-term lows and sell stops (liquidity pools) when expecting higher prices, often referred to as the “Judas swing.”
Identifying Liquidity Zones
- Short-Term Lows and Sell Stops: These are prime liquidity zones where market makers may target.
- Optimal Timeframes for Imbalances:
- 1m, 2m, 3m Timeframes: Ideal for spotting imbalances in indices.
- 5m Timeframe: Still effective but leaves room for imbalances below this range.
Entry and Exit Strategies
- Entering Trades: Enter within the FVG, setting a stop loss at the next candle above the FVG.
- Exiting Trades: Target the liquidity zone for exits to maximize profits.
Leveraging Fibonacci Levels
- Use Fibonacci retracement levels to evaluate market conditions:
- Markets above the 50% marker are “expensive,” signaling a potential short.
- Markets below the 50% marker are “cheap,” signaling a potential long.
- This analysis helps anticipate algorithmic pushes in the market.
The Prime Trading Window
- Focus on the 8:30 AM EST to 11:00 AM EST window, a sweet spot for trading activity emphasized by ICT strategies. Learn more about ICT Killzone Time
Homework of Episode 2
Analyze the E-mini and S&P charts to identify breaks of structure and look for areas of price imbalance. Mark the opposite highs and lows where these imbalances occur, then backtest your findings in your log for further analysis.
Home Work Solution: Episode 2

ICT mentorship 2022: episode 3- Understating Internal Range Liquidity
Below is the executive summary of episode 3
What Is Internal Range Liquidity (IRL)?
Internal Range Liquidity is a concept where traders identify liquidity pools within the market’s internal structure. These zones represent areas where stop orders are likely clustered, offering high-probability setups for entry and exit. By targeting these zones, you align your strategy with how algorithms and institutional traders operate.

Understanding Market Structure Shifts (MSS)
A Market Structure Shift (MSS) signals a change in price direction but only occurs when liquidity is taken out. For example:
- If price sweeps a key liquidity pool (e.g., short-term highs or lows) and reverses, this often marks an MSS.
- MSS is distinct from a market structure break (MSB). While both involve price movement beyond key levels, an MSS requires a clear liquidity grab before shifting direction.
How to Use Premium and Discount Zones Effectively
Premium and discount zones help traders gauge whether the market is expensive (premium) or cheap (discount):
- Premium Zones: Above the 50% level of a range, indicating potential areas to short.
- Discount Zones: Below the 50% level, signaling opportunities to go long.
Overlaying these zones with Fair Value Gaps (FVGs) provides an edge by pinpointing optimal entry points aligned with institutional trading behaviors.
Mastering Order Block Theory
An order block marks a significant shift in the state of delivery, often leading to a price reversal. However, not every candle fits the definition:
- Bullish Order Block: A down-closed candle within a broader uptrend.
- Bearish Order Block: An up-closed candle in a downtrend.
Order blocks frequently form near liquidity zones, making them critical components of high-probability trade setups.
Pro Tip for Identifying Order Blocks
Focus on clusters of candles leading into a liquidity sweep rather than isolated candles. These clusters are more likely to hold significance as they represent areas of institutional accumulation or distribution.
Low-Hanging Fruit: Approach
Simplify your trading by focusing on setups with clear liquidity targets and minimal risk. These “low-hanging fruit” opportunities are perfect for building confidence and consistency as you refine your understanding of the model.
Episode 4: ICT Mentorship- Examples
Discuss just trading examples.


ICT Mentorship 2022: Episode 5- Daily Bias and Liquidity Points
Below is the executive summary of episode 5.
Liquidity and Swing Points
Liquidity often rests above and below significant swing points, making these levels critical for identifying trade opportunities. To locate them:
- Use the 15-minute timeframe to identify obvious swing highs and lows.
- A swing high forms when a candle has a lower high on both the left and right, creating a three-candle pattern. A swing low is the inverse.
After identifying swing points, drop down to a 5-minute chart to refine your entry using your trading model.
The Classic Three Drives Pattern
The Three Drives Pattern is a universal formation visible across all timeframes. It consists of three clear pushes in one direction before reversing or continuing the trend.
- Key Insight: The pattern doesn’t always need to sweep a high or low. However, if it does align with a liquidity raid or stop hunt, the setup gains more significance.

This pattern is especially valuable when paired with other tools like Fair Value Gaps (FVGs) or order blocks for entries.
Understanding Displacement
Displacement is a core ICT concept that highlights sharp, obvious movements in price, signaling strength in a particular direction.
- For example, when the market trades above an old high, look for an unmistakable displacement. This movement often leaves behind FVGs that provide high-probability entry zones.
Displacement confirms the presence of institutional activity and is a key indicator for trend continuation.
Scalping with SMT (Smart Money Tool)
Scalping opportunities arise when you spot divergence using SMT:
- Compare two correlated instruments (e.g., indices or currency pairs).
- Look for one making higher highs while the other fails to do so (or vice versa).
- This divergence often marks a liquidity grab, creating a high-probability setup.
Episode 6 and Institutional Order Flow
Understanding the Market Efficiency Paradigm
At the heart of the Market Efficiency Paradigm (MEP) lies the principle that price always seeks opposing liquidity. Whether the market is trending or ranging, its movements are driven by the need to fill orders at key liquidity points.

The Importance of Timing
Time of day plays a pivotal role in how price behaves, particularly during high-impact sessions.
- NYSE Open Behavior: The first price move after the New York Stock Exchange opens (9:30 AM EST) often runs opposite to the eventual trend of the session. This initial move is a liquidity grab, creating opportunities for traders to enter in the direction of the dominant trend.
- Key Sessions:
- London: Sets the early liquidity traps.
- New York: Provides the dominant trend for the day.
- Asia: Consolidation or preparation for the next session’s liquidity hunt.

Episode 7 :2022 ICT Mentorship- Consolidation Hurdles
Understanding Daily Bias
The concept of daily bias revolves around aligning your trades with the dominant trend or momentum of the day. Misinterpreting this bias can lead to frustration, especially in consolidation-heavy markets.
- Key Insight: Use higher timeframes (1D and 4H charts) to establish a macro perspective, then drill down to lower timeframes like 15m or 2m to refine entries.
- Example: Nasdaq 100 and S&P E-Mini Futures are great benchmarks for observing market bias shifts and liquidity hunts.

Bias Around Equilibrium
Equilibrium represents the mid-point of a price range, offering a balanced perspective on whether price is overbought or oversold.
- How to Apply:
- Identify the daily range using swing highs and lows.
- Mark the equilibrium point (50% of the range).
- Observe price behavior around this level:
- Above equilibrium: Bullish bias.
- Below equilibrium: Bearish bias.
- Tip: Combine equilibrium analysis with SMT (Smart Money Techniques) divergence for stronger confirmations.
Smart Money Techniques (SMT) Divergence
Use SMT divergence is a powerful tool for confirming trade ideas. It identifies discrepancies between correlated markets, such as Nasdaq, S&P, and Dow.
Example:
- If the Nasdaq creates a higher high while the Dow forms a lower high, this divergence could indicate a pending reversal.
- Use SMT divergence as a final layer of confirmation, not as the sole indicator.
Episode 8: Applying Institutional Order Flow to Forex Markets
Understanding Institutional Order Flow in Forex
Institutional order flow refers to the movement of large volumes of currency by institutional traders. Observing this flow helps retail traders align with the dominant market direction and avoid getting trapped in liquidity hunts.
Key Points Discussed
1. Forex Bias Through Futures Charts
- For pairs like EUR/JPY, you can analyze futures charts of both EUR and JPY to gauge longer-term bias.
- Example:
- If EUR futures are trending higher and JPY futures are trending lower, the bias for EUR/JPY is bullish.
- Tip: Cross-referencing futures helps isolate individual currency strength or weakness, providing a more reliable outlook.
2. Multi-Timeframe Analysis
- Start with the daily chart for a macro view of the trend.
- Drill down to lower timeframes for entry:
- 15m Chart: Identifies intraday structure and potential liquidity pools.
- 5m Chart (NY ICT Kill Zone): Perfect for finding entries during high-volume sessions, especially the New York Kill Zone (7 AM to 10 AM EST).
- 3m Chart: Fine-tunes entries around displacement and FVGs.
3. Using Fibonacci for Targeting
- Use the Fibonacci retracement tool to identify how far price might trade.
- Look for price to interact with key levels like 62%, 70.5%, or 79%.
- Displacement is key: FVGs within displacement zones often align with Fibonacci levels, providing high-probability setups.
4. Trading Non-NY Sessions
While NY sessions are preferred due to high liquidity, other sessions can also provide opportunities:
- London Session: Best for GBP and EUR pairs.
- Asia Session: Works well for JPY pairs but is less volatile, which ICT personally avoids.
Currencies do not trade in isolation—understanding their relationships is crucial:
- Example:
- EUR/JPY Analysis:
- EUR futures trending up = EUR strength.
- JPY futures trending down = JPY weakness.
- Result: Bullish bias for EUR/JPY.
- Use intermarket relationships to confirm trade setups.
- EUR/JPY Analysis:
ICT’s Perspective on Yen Pairs
- ICT avoids JPY pairs due to their often erratic behavior and tendency for unpredictable liquidity spikes.
- If trading Yen pairs, rely heavily on futures charts for bias confirmation and avoid over-leveraging.
Actionable Steps for Applying Institutional Order Flow in Forex
- Set Daily Bias: Use futures charts of individual currencies to establish the bias for a forex pair.
- Multi-Timeframe Analysis: Start with daily, refine with 15m and 5m, and pinpoint entries on 3m charts.
- Utilize FVGs and Fib Levels: Look for trades aligning with displacement zones and Fibonacci retracement targets.
- Focus on Relationships: Analyze how related currencies interact to confirm setups.
- Trade During Kill Zones: Prioritize high-liquidity times like the NY Kill Zone for optimized trades.
By integrating institutional order flow principles and understanding the deeper dynamics of currency futures, traders can elevate their forex strategies to align with the movements of institutional players.
Episode 9: Power of 3 & New York PM Session Opportunities
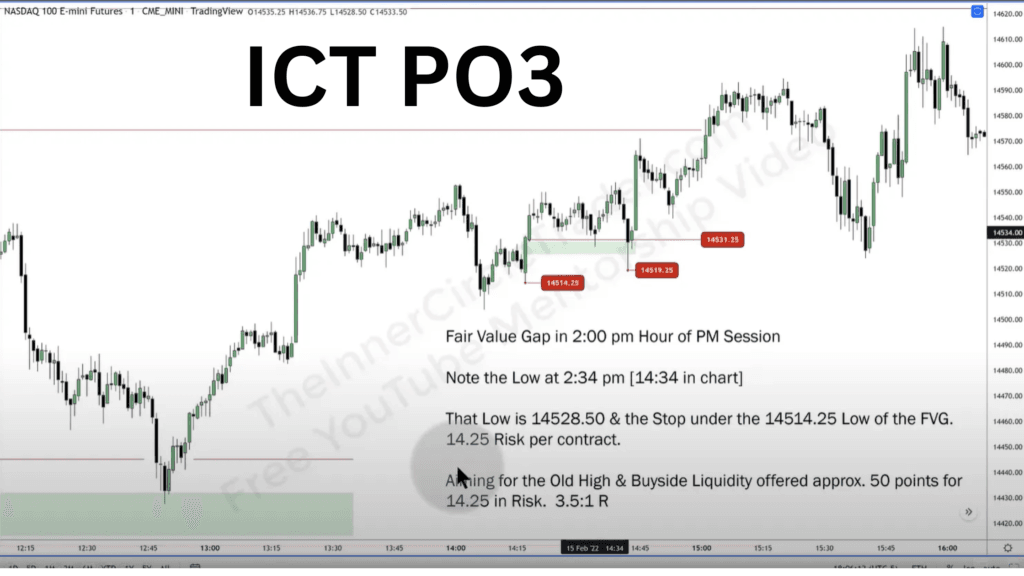
Power of 3: Accumulation, Manipulation, Distribution
The Power of 3 framework applies across all timeframes and involves three stages:
- Accumulation: Price consolidates, building liquidity.
- Manipulation: Price deviates from consolidation to grab liquidity.
- Distribution: Price trends in the intended direction after taking out liquidity.