What is a Candlestick Chart?
Before diving into the patterns themselves, it’s essential to understand the chart they live on. A candlestick chart is a type of financial chart used to describe price movements of a security, derivative, or currency. Its origins trace back to 18th-century Japan, where a legendary rice trader named Munehisa Homma developed the technique to track the price of rice.
Homma realized that market price was influenced not just by supply and demand, but also by the emotions of traders. His candlestick method captured this human element brilliantly, and its effectiveness has stood the test of time, remaining a cornerstone of modern technical analysis.
At its core, each candlestick represents a specific time period (e.g., one minute, one hour, one day) and provides four key pieces of information: the Open, High, Low, and Close prices, collectively known as OHLC.
- Open: The price at the beginning of the period.
- High: The highest price reached during the period.
- Low: The lowest price reached during the period.
- Close: The price at the end of the period.
This simple structure makes candlestick charts far more informative than traditional line charts, which typically only plot the closing price. By visualizing the full trading range and direction of price movement, traders can quickly gauge market sentiment. For a deeper dive, many traders keep a candlestick pdf on hand to reference these fundamentals quickly.
Candlestick Anatomy
To read the story each candlestick tells, you must first understand its anatomy. It’s surprisingly simple, consisting of just two main parts: the body and the wicks (also known as shadows or tails).
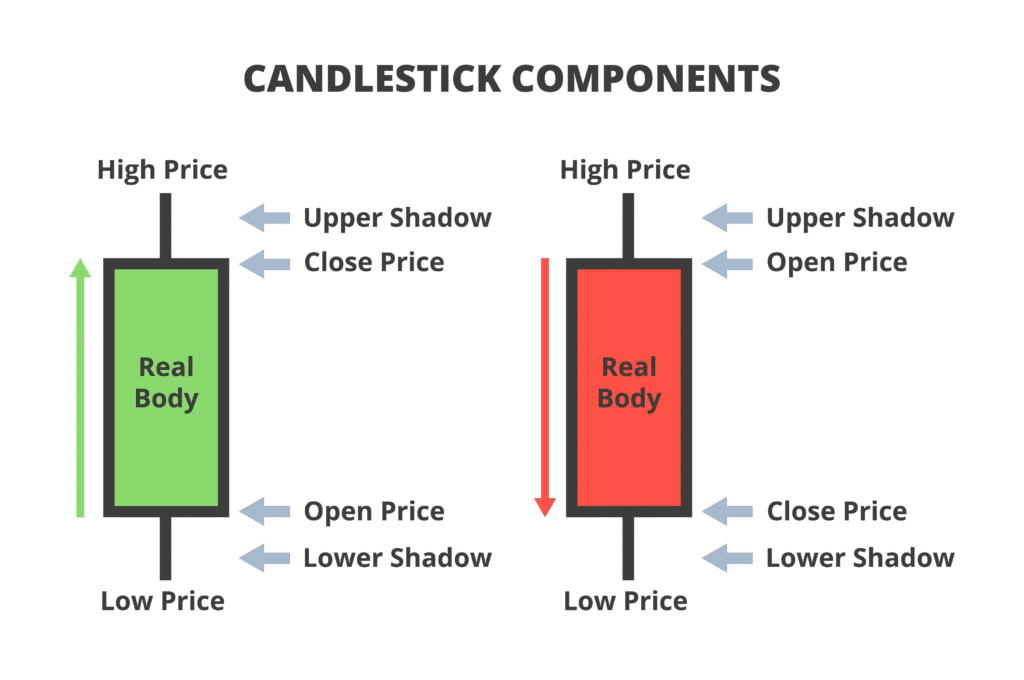
- The Body: The wide part of the candlestick represents the range between the opening and closing prices. The color of the body tells you the direction of the price movement.
- Bullish Candle (Green/White): The close price was higher than the open price. This indicates buying pressure and a positive sentiment during that period.
- Bearish Candle (Red/Black): The close price was lower than the open price. This indicates selling pressure and a negative sentiment.
- The Wicks (Shadows): These are the thin lines extending above and below the body. They represent the highest and lowest prices reached during the period.
- Upper Wick: The peak of the upper wick shows the high of the period.
- Lower Wick: The bottom of the lower wick shows the low of the period.
The length of the body and wicks provides valuable clues. A long body suggests strong buying or selling pressure, while long wicks indicate significant volatility and a struggle between bulls and bears. A candle with a small body and long wicks, for example, signals indecision in the market. See the figure for a clear illustration of candlestick anatomy.
Types of Candlestick Patterns
Candlestick patterns are categorized based on the number of candles required to form the pattern. This structure helps in determining the strength and reliability of the signal. We will explore them in three main groups.
What is a Single Candlestick Pattern?
A single candlestick pattern is a formation on a financial chart that consists of just one candle. Despite its simplicity, it is a powerful tool used by traders to forecast potential changes in market direction.
Each individual candle provides a snapshot of the battle between buyers (bulls) and sellers (bears) over a specific time period. By analyzing its shape—the size of its body and the length of its wicks—traders can gain immediate insight into market sentiment.
These patterns can signal a potential reversal of the current trend, a continuation of the trend, or simply a period of indecision and consolidation. Their primary strength lies in their ability to provide early warning signs, allowing traders to anticipate market moves before more complex, multi-candle formations have fully developed. Mastering these foundational patterns is the first step toward reading the nuanced language of price action.
35 Most Powerful Candlestick Patterns
1.The Hammer
A Hammer is a distinct candlestick characterized by a small body located at the top of the trading range, with little to no upper wick and a very long lower wick. To be considered a valid Hammer, the lower wick must be at least two times the size of the body. This unique shape tells a dramatic story of a single trading session. The session opens, and sellers take immediate and aggressive control, pushing the price significantly lower, which forms the long lower wick. However, before the session closes, a powerful wave of buying pressure emerges, rejecting the lower prices and driving the price all the way back up to close near its opening level. The color of the body can be either green (bullish) or red (bearish), but the bullish reversal implication remains the same. A green Hammer is generally considered slightly more potent, as it shows that buyers not only defended the lows but also managed to push the price above the open. The pattern’s visual resemblance to a hammer striking a bottom perfectly encapsulates its function as a signal that the market is attempting to forge a support level and hammer out a base.
- Meaning: The Hammer is a bullish reversal pattern. It signifies that although sellers were initially in control, buyers stepped in with significant force, indicating that the selling pressure is exhausted and a potential price bottom is forming.
- Where it is found: It is a crucial signal that appears at the bottom of a downtrend.
2. The Inverted Hammer
The Inverted Hammer is the mirror image of the Hammer pattern, featuring a small body at the lower end of the trading range, a long upper wick, and little to no lower wick. The long upper wick must be at least twice the length of the body. The narrative of this candle begins with the open, after which buyers make a strong attempt to push the price higher. This buying enthusiasm creates the long upper wick. However, their momentum does not last, and sellers step in to push the price back down, causing it to close near the open. While this might seem bearish on the surface because the buyers failed to hold the highs, the context is critical. After a prolonged downtrend, the fact that buyers showed any significant strength at all is a notable event. It suggests that buying interest is starting to build, and the sellers’ power to keep pushing the price down is weakening. The color of the body can be red or green, but the pattern’s potential bullish implication is unchanged. It serves as a warning to short-sellers that the market dynamics may be shifting from bearish to bullish.
- Meaning: The Inverted Hammer is a potential bullish reversal pattern. It indicates that buyers are starting to test the waters after a downtrend, and a reversal could be imminent if confirmed.
- Where it is found: It appears at the bottom of a downtrend.
3. The Hanging Man
The Hanging Man has the exact same appearance as a Hammer—a small body at the top, a long lower wick, and almost no upper wick. The critical difference between the two is not their shape but their location on the chart. While the Hammer forms after a decline, the Hanging Man appears after a sustained price advance. Its formation tells a cautionary tale during an uptrend. The market opens, and for a period, significant selling pressure emerges, driving prices down substantially to create the long lower wick. Although the bulls manage to fight back and push the price to close near the open, this intra-session sell-off is a major red flag. It reveals a crack in the bulls’ armor, showing that a large number of sellers are present and willing to unload their positions. This sudden influx of selling pressure suggests that the bullish momentum that drove the uptrend is beginning to wane. The appearance of this pattern is like a warning light, signaling that the foundation of the uptrend is no longer secure and the market could be vulnerable to a reversal.
- Meaning: The Hanging Man is a bearish reversal pattern. It suggests that selling interest is increasing and that the peak of the uptrend may be near.
- Where it is found: It forms at the top of an uptrend.
4. The Shooting Star
The Shooting Star is visually identical to the Inverted Hammer but, like the Hanging Man, its power comes from its position at the end of an uptrend. It is composed of a small body at the lower end of the trading range, a long upper wick, and a very small or non-existent lower wick. During the trading session, the market opens and bulls continue their confident advance, pushing the price significantly higher. This action forms the long upper wick and appears, for a time, to be a continuation of the prevailing uptrend. However, this peak is unsustainable. Sellers step into the market with decisive force, rejecting the higher prices and pushing the market all the way back down to close near its opening level. This failure to hold the highs is a significant sign of weakness. It demonstrates that despite the initial buying pressure, the bears ultimately won the session, trapping the late buyers at the top. The image of a star falling from the sky is a fitting metaphor for this pattern, as it often signals the peak of an asset’s price before it begins to fall.
- Meaning: The Shooting Star is a significant bearish reversal pattern. It indicates a rejection of higher prices and shows that sellers have taken control from the buyers.
- Where it is found: It occurs at the top of an uptrend.
5. The Dragonfly Doji
A Dragonfly Doji is one of the most distinct and powerful single-candle patterns, representing a perfect stalemate between buyers and sellers at a critical moment. Its structure is unique: it has no real body, meaning the open, high, and close prices are all identical or extremely close to one another. Below this price level, a long lower wick extends, while there is no upper wick. The story of this candle is one of dramatic reversal within a single session. The period opens, and sellers immediately take command, driving the price significantly lower. This bearish push creates the long lower wick. However, the move is aggressively rejected. Buyers enter the market with overwhelming force, driving the price all the way back up to its opening level by the time the session closes. This complete retracement signifies a powerful rejection of lower prices. It’s as if the market looked down into an abyss, recoiled, and flew back up, hence the name “Dragonfly.” The failure of the bears to hold any of their gains is a clear sign of their exhaustion and the rising strength of the bulls.
- Meaning: The Dragonfly Doji is a potent bullish reversal pattern. It indicates that the market has rejected lower prices and that a strong buying force has emerged, often signaling the end of a downtrend.
- Where it is found: It appears at the bottom of a downtrend, often at a key support level.
6. The Gravestone Doji
The Gravestone Doji is the bearish counterpart to the Dragonfly Doji and is equally significant as a reversal indicator. It is formed when the open, low, and close prices are all the same, creating no real body, with a long upper wick extending above this price level. It has little to no lower wick. This pattern tells a story of a failed rally. The trading session begins, and enthusiastic buyers push the price significantly higher, continuing the prevailing uptrend. This creates the long upper wick and gives the initial impression of bullish strength. However, this peak proves to be a trap. Sellers enter the market with overwhelming force, erasing all the session’s gains and pushing the price all the way back down to its opening level. The bulls’ inability to defend any of their progress is a stark sign of weakness. The name “Gravestone” is fitting, as it often marks the death of an uptrend, serving as a tombstone for the bullish momentum. It represents a final, exhaustive push upward that is decisively rejected by the bears.
- Meaning: The Gravestone Doji is a strong bearish reversal pattern. It signifies a powerful rejection of higher prices and indicates that sellers have taken control of the market.
- Where it is found: It forms at the top of an uptrend, frequently at a key resistance level.
7. The Bullish Marubozu
The Bullish Marubozu is the ultimate symbol of bullish conviction and is one of the easiest patterns to identify. Its name means “shaved head” or “bald” in Japanese, which perfectly describes its appearance: a long green (or white) candle with a full body and no upper or lower wicks. This structure means that the opening price was the absolute low of the session, and the closing price was the absolute high. From the moment the session opened to the moment it closed, the buyers were in complete and utter control, without any significant interference from sellers. There was no hesitation, no pullback—just a relentless, one-sided push upward. A Bullish Marubozu indicates that bullish sentiment is extremely strong and that market participants were willing to buy at every price point throughout the entire session. This pattern is a powerful statement of intent and often signals either the strong start of a new uptrend or a powerful continuation of an existing one. It leaves no doubt about who is in charge of the market.
- Meaning: The Bullish Marubozu is a strong bullish continuation or reversal pattern. It represents absolute buying control and powerful upward momentum.
- Where it is found: It can be found at the start of an uptrend (as a reversal signal) or during an uptrend (as a continuation signal).
8. The Bearish Marubozu
The Bearish Marubozu is the direct opposite of its bullish counterpart and signifies absolute bearish dominance. It appears as a long red (or black) candle with a full body but no upper or lower wicks. This means the session opened at its highest point and closed at its lowest point. Throughout the entire trading period, sellers controlled the price action completely. From the opening bell to the close, there was no meaningful rally attempt from buyers. The price moved in only one direction: down. This pattern reflects extreme negative sentiment and shows that sellers were aggressively unloading their positions at any available price, while buyers were nowhere to be found. A Bearish Marubozu is an unambiguous signal of strength from the sellers. It can mark the beginning of a powerful new downtrend or confirm that an existing downtrend has plenty of momentum left to continue its fall. It is a clear and powerful signal that the bears are in complete command.
- Meaning: The Bearish Marubozu is a strong bearish continuation or reversal pattern. It represents total selling pressure and intense downward momentum.
- Where it is found: It can appear at the top of an uptrend (as a reversal) or during a downtrend (as a continuation).
9. The Spinning Top
A Spinning Top is a candlestick that signals indecision and uncertainty in the market. It is defined by a very small body, which can be either bullish (green) or bearish (red), positioned in the middle of a trading range that features long upper and lower wicks of roughly equal size. The small body indicates that there was very little difference between the opening and closing prices, meaning neither buyers nor sellers could gain a meaningful advantage by the end of the session. The long wicks, however, tell a story of significant conflict. During the period, both bulls and bears made aggressive moves, pushing the price both significantly higher and significantly lower. Yet, neither side could sustain its momentum, and the price ultimately closed near where it started. A Spinning Top essentially represents a stalemate. It shows that the forces of supply and demand are in relative balance. The pattern itself is neutral, but its context is everything. Its appearance after a long uptrend or downtrend can be a powerful warning that the current momentum is fading and a change in direction may be coming.
- Meaning: The Spinning Top is a neutral pattern indicating indecision. However, it can signal a potential reversal when it appears after a strong trend.
- Where it is found: It can be found anywhere, but it is most significant at the top of an uptrend or the bottom of a downtrend.
10. The Spinning Bottom
The Spinning Bottom is simply a specific application of the Spinning Top pattern. While “Spinning Top” is the general name for the candle shape, when this particular candle of indecision appears specifically after a prolonged downtrend, it is often referred to as a Spinning Bottom. The formation is identical: a small body with long upper and lower wicks, showing that a fierce but inconclusive battle took place between buyers and sellers. The reason it earns a more specific name in this context is due to its potent implication. After a long period of sellers being in firm control (the downtrend), the appearance of a Spinning Bottom is a significant event. It shows that for the first time in a while, the sellers were unable to push the price decisively lower. The buyers fought back with enough force to create a long lower wick and prevent a lower close. This shift from one-sided selling to a state of equilibrium is often the first sign that the downtrend is losing its power and that a potential bottom or base is forming, from which a new uptrend could be launched.
- Meaning: A bullish reversal pattern indicating that the momentum of a downtrend is fading and a potential price bottom is near.
- Where it is found: It is specifically identified at the bottom of a downtrend.
What is a Double Candlestick Pattern?
Double candlestick patterns are formations that consist of two consecutive candles. They offer a more detailed and often more reliable narrative about market sentiment than single-candle patterns. By analyzing the interaction between two trading periods, these patterns provide a stronger confirmation of a potential shift in momentum. The relationship between the size, color, and position of the two candles reveals a clearer picture of the struggle between buyers and sellers. For example, a pattern might show the bears in control during the first period, only to be completely overwhelmed by the bulls in the second, signaling a powerful reversal. Mastering these two-candle signals is a crucial step in learning to read the market’s intentions with greater accuracy.
Bullish Double Candlestick Patterns
11. The Bullish Engulfing Pattern
The Bullish Engulfing is a powerful two-candle reversal pattern that signals a potential bottom in a downtrend. The first candle is a bearish (black) candle, which is then completely “engulfed” by a larger bullish (white) candle on the second day. This means the body of the second candle opens lower than the previous close and closes higher than the previous open, completely covering the first candle’s body. The formation tells a clear story of a dramatic shift in market control. The first candle shows that sellers are still in charge, continuing the downtrend. However, the second candle demonstrates a massive surge in buying pressure that not only negates the sellers’ efforts from the previous period but also establishes a new, aggressive bullish sentiment. This pattern indicates that the market is no longer under the control of sellers and that buyers will take control. When a Bullish Engulfing pattern forms at the end of a downtrend, the reversal signal is considered much more powerful.
- Meaning: The Bullish Engulfing pattern is a strong bullish reversal signal. It signifies that buying pressure has overwhelmed selling pressure.
- Where it is found: It occurs at the bottom of a downtrend.
12. The Bullish Harami (Inside Bar)
The Bullish Harami pattern, also known as an Inside Bar, is a two-candle pattern that signals a potential bullish reversal. The name “Harami” is Japanese for “pregnant,” which is a fitting description for its appearance. The pattern consists of a large bearish (black) “mother” candle, followed by a much smaller bullish (white) “baby” candle whose entire range is contained within the first candle. For the pattern to be valid, the second, smaller candle must be completely covered by the mother candle. This formation indicates a significant decrease in momentum and a period of indecision in the market. After a strong downtrend, represented by the long mother candle, the small second candle shows that the sellers lacked the strength to push the price further down. This pause or consolidation suggests that the selling power is waning and that buyers might be preparing to take control.
- Meaning: The Bullish Harami is a bullish reversal pattern. It indicates that the bearish trend’s momentum has stalled, signaling indecision that often precedes a move higher.
- Where it is found: It appears at the bottom of a downtrend.
13. The Tweezer Bottom
The Tweezer Bottom is a bullish reversal pattern formed by two consecutive candles that have identical or nearly identical lows. This pattern consists of a bearish (black) first candle, followed by a bullish (white) second candle. The crucial feature is that both candles stop at the same support level, forming a “tweezer-like” shape. The psychology behind this pattern is straightforward but powerful. During a downtrend, sellers push the market lower in the first session. However, in the next session, the price opens and goes straight up, closing at roughly the same price level as the first bearish candle’s open. This action indicates that buyers have stepped in to reverse the market’s direction. This strong rejection from the lows signifies that a solid support level has been established and that buying pressure is significant enough to absorb all selling.
- Meaning: The Tweezer Bottom is a bullish reversal pattern. It signifies a strong rejection of lower prices and the formation of a key support level.
- Where it is found: It is seen at the bottom of a downtrend.
14. The Piercing Line
The Piercing Line is a significant two-candle bullish reversal pattern. The first candle is a long, strong bearish (black) candle that continues the existing downtrend. The second candle is a bullish (white) candle that opens with a gap down, below the low of the first candle. This initial gap down makes it seem like the bearish momentum is accelerating. However, buyers then step in with immense force and drive the price all the way up, causing the candle to close more than halfway up the body of the first bearish candle. This strong recovery into the territory of the previous day’s selling pressure is a clear sign of bullish strength. It shows that despite a bearish start, the buyers overwhelmed the sellers and managed a powerful comeback, suggesting that the downtrend has lost its momentum and a reversal is likely. The deeper the second candle “pierces” into the body of the first candle, the more significant the pattern is considered.
- Meaning: The Piercing Line is a bullish reversal pattern indicating that buying pressure is strong enough to reverse the bearish trend.
- Where it is found: It occurs at the bottom of a downtrend.
Bearish Double Candlestick Patterns
15. The Bearish Engulfing Pattern
Bearish Engulfing pattern is one of the most important bearish candlestick patterns and appears at the end of an uptrend. It is composed of two candles: a smaller bullish (white) candle followed by a second, larger bearish (black) candle whose body completely engulfs the body of the first one. This pattern provides a clear and powerful illustration of a shift in market sentiment from bullish to bearish. The first candle shows the bulls are still pushing the price higher. However, the second candle shows that sellers have stepped in with overwhelming force, completely erasing the gains of the prior session and seizing control of the market. When this pattern forms at the top of an uptrend, it indicates that buyers have been engulfed by sellers and signals a probable trend reversal to the downside.
- Meaning: The Bearish Engulfing is a strong bearish reversal pattern. It indicates that sellers are now in control of the market.
- Where it is found: It is found at the top of an uptrend.
16. The Bearish Harami (Inside Bar)
Bearish Harami is a two-candle pattern that suggests a potential bearish reversal at the top of an uptrend. It consists of a very large bullish (white) mother candle, which is then followed by a much smaller bearish (black) baby candle that is completely contained within the range of the mother candle’s body. This pattern signifies indecision in the market. After a strong bullish run, the small bearish candle that follows indicates that the buyers did not have the conviction to continue pushing the price higher. This hesitation at the top of a trend is a warning sign that bullish sentiment is fading. The market is pausing, and neither buyers nor sellers are in firm control, which often precedes a change in direction.
- Meaning: The Bearish Harami is a bearish reversal pattern. It signals that the prevailing uptrend is losing strength and the market is entering a period of indecision.
- Where it is found: It occurs at the top of an uptrend.
17. The Tweezer Top
Tweezer Top is a bearish reversal pattern made up of two candlesticks that appears at the end of an uptrend. The first candle is bullish (white), and the second candle is bearish (black). The defining characteristic of this pattern is that both candles have identical or nearly identical highs. This formation represents a failed attempt by the bulls to push the price higher. During the first session, buyers successfully drive the price up. In the second session, they attempt to do so again but are met with strong selling pressure at the same high point. This repeated failure to break above a specific resistance level indicates that the ceiling is solid and that the bears are strong enough to defend it. The “tweezer” formation at the top visually represents this strong resistance and signals that upward momentum has likely ended.
- Meaning: The Tweezer Top is a bearish reversal pattern. It indicates strong resistance and signals that a downtrend is likely to begin.
- Where it is found: It is seen at the top of an uptrend.
18. The Dark Cloud Cover
The Dark Cloud Cover is a bearish reversal pattern that signals a potential top in the market. This two-candle pattern begins with a strong bullish (white) candle that continues the existing uptrend. The second candle is a bearish (black) candle that opens with a gap up, above the high of the first candle. Initially, this gap up creates the impression that the bullish trend is still very strong. However, sellers then step in and take control, pushing the price all the way down so that the candle closes well into the body of the first candle, preferably more than halfway down. This action signifies a significant rejection of higher prices. The fact that sellers were able to completely reverse the initial bullish gap and erase more than half of the previous day’s gains is a powerful sign of a shift in momentum. The “dark cloud” covers the optimism of the previous day, suggesting that a downtrend is imminent.
- Meaning: The Dark Cloud Cover is a bearish reversal pattern. It shows a significant shift in momentum from buyers to sellers and a rejection of higher prices.
- Where it is found: It appears at the top of an uptrend.
Certainly. Here is the section on Triple Candlestick Patterns, continuing the numbering from 19 and following the same detailed format.
TRIPLE (MULTI) CANDLESTICK PATTERNS
What is a Triple Candlestick Pattern?
Triple candlestick patterns are formations composed of three consecutive candles. They are among the most reliable signals in technical analysis because they provide a comprehensive, three-session view of the market’s psychology. The first candle typically establishes the prevailing trend, the second candle signals a moment of indecision or a potential shift in momentum, and the third candle acts as the confirmation, validating the reversal or continuation. This three-step narrative offers a much clearer and more confirmed signal than single or double patterns, making them a favorite among professional traders for identifying major market turning points with higher accuracy.
Below are the most powerful triple candlestick patterns:
Bullish Triple Candlestick Patterns
19. The Morning Star
The Morning Star is a significant bullish reversal pattern that occurs at the bottom of a downtrend and consists of three candles. 1The first candlestick is a large bearish candle, which shows that sellers are still in command of the market. 2The second candle is a small one, which can be bullish or bearish, representing a moment of indecision where sellers are still in control but are struggling to push the market much lower. 3The third candle is a strong bullish candlestick that ideally gaps up on the open and must close above the midpoint of the first candle’s body. 4This pattern graphically displays how buyers took control of the market from sellers. 5The first candle confirms the seller’s domination, the second produces indecision, and the third bullish candle indicates that buyers have taken firm control from sellers and the market is likely to reverse. 6666
- Meaning: The Morning Star is considered a powerful bullish reversal pattern. 777
- Where it is found: It often occurs at the bottom of a downtrend and is particularly significant near a support level. 8
20. The Three White Soldiers
The Three White Soldiers is a very strong bullish reversal pattern. It is composed of three consecutive, long-bodied bullish candles that open within the previous day’s body and close progressively higher than the previous day. Each candle should close near its high, indicating that bulls dominated the session from open to close. The staircase-like advance created by these three candles is a clear visual representation of sustained and powerful buying pressure that has firmly taken control from the sellers. This is not a pattern of indecision; it is a pattern of strength. Its appearance after a period of decline or consolidation is a very clear signal that market sentiment has shifted decisively from bearish to bullish and that a new uptrend has likely begun.
- Meaning: A potent bullish reversal pattern that signifies a strong and sustained shift in momentum to the upside.
- Where it is found: It appears at the end of a downtrend.
21. The Three Inside Up
The Three Inside Up is a three-candle bullish reversal pattern that provides confirmation to a Bullish Harami. The pattern begins with a large bearish candle that continues the downtrend. The second candle is a small bullish candle that is completely contained within the body of the first candle (forming a Bullish Harami). This initial two-candle setup signals indecision and a potential bottom. The third candle is the confirmation: it is a strong bullish candle that closes above the high of the very first bearish candle. This third candle validates the reversal by showing that buyers have not only absorbed the selling pressure but have successfully pushed the price beyond the range of the initial downtrend day, confirming that the bulls have taken control.
- Meaning: A confirmed bullish reversal pattern. The third candle validates the reversal hinted at by the initial Harami pattern.
- Where it is found: It forms at the bottom of a downtrend.
The Evening Star pattern is a bearish reversal pattern that usually occurs at the top of an uptrend. 9It is the bearish version of the Morning Star and consists of three candlesticks. 101010The first candle is a strong bullish candle, which means that bulls are still pushing the market higher. 11111111The second candle is a small candlestick (it can be bullish or bearish, or a Doji), which shows that buyers are still in control but are not as powerful as they were. 12121212This candle indicates price consolidation and indecision. 13The third candle is a large bearish candle. 14This final candle indicates that the buyers’ domination is over and a bearish trend reversal is likely to happen. 15Its appearance confirms the reversal and the beginning of a new trend down. 16
- Meaning: The Evening Star is considered a significant bearish reversal pattern. 17
- Where it is found: It typically occurs at the top of an uptrend. 18
23. The Three Black Crows
The Three Black Crows is a powerful bearish reversal pattern and the counterpart to the Three White Soldiers. It consists of three consecutive, long-bodied bearish candles that close progressively lower than the previous day. Ideally, each of the three candles opens within the body of the candle before it and closes near its low, creating a distinct downward-stepping pattern. This formation is a clear sign of intense and sustained selling pressure. It indicates that the sellers have seized control from the buyers and are aggressively pushing the market down. After a strong uptrend, the appearance of Three Black Crows signals that the bullish momentum has been decisively broken and that a significant downtrend is likely to follow.
- Meaning: A strong bearish reversal pattern that signals a definitive shift in momentum from bullish to bearish.
- Where it is found: It appears at the top of an uptrend.
24. The Three Inside Down
The Three Inside Down is a three-candle bearish reversal pattern that confirms the potential weakness suggested by a Bearish Harami. The pattern begins at the top of an uptrend with a large bullish candle. This is followed by a small bearish candle that is completely contained within the body of the first bullish candle (forming a Bearish Harami). This two-candle setup shows that the bullish momentum has stalled. The third candle provides the bearish confirmation: it is a strong bearish candle that closes below the low of the first bullish candle. This close confirms that the sellers have taken control, breaking below the range of the initial uptrend day and signaling that a reversal to the downside is now underway.
- Meaning: A confirmed bearish reversal pattern. It validates the indecision of the Harami pattern with a strong bearish move.
- Where it is found: It forms at the top of an uptrend.
Of course. Here are the remaining 11 candlestick patterns to complete the list of 35, continuing the numbering from 25. This section includes more complex multi-candle and continuation patterns.
Other Powerful Candlestick Patterns
25. The Bullish Abandoned Baby
The Bullish Abandoned Baby is an extremely rare but very powerful three-candle bullish reversal pattern. It is considered one of the most reliable reversal signals. The pattern starts with a long bearish candle during a downtrend. The second candle is a Doji that opens with a significant gap down, completely below the low of the first candle (including its shadow). This Doji represents the point of maximum pessimism where the trend is exhausted. The third candle is a strong bullish candle that opens with a gap up, above the high of the Doji, and closes well into the body of the first bearish candle. The Doji is left “abandoned” like a baby on a doorstep, isolated from the price action of the candles before and after it. This complete separation signals a violent and decisive shift from selling pressure to buying pressure.
- Meaning: An extremely strong bullish reversal pattern.
- Where it is found: At the absolute bottom of a downtrend.
26. The Bearish Abandoned Baby
The Bearish Abandoned Baby is the bearish counterpart to the bullish version and is an exceptionally strong bearish reversal pattern. It occurs at the top of an uptrend and consists of three candles. The first candle is a long bullish candle continuing the uptrend. This is followed by a Doji that gaps significantly up, with its entire range (including shadows) above the high of the first candle. This Doji shows a moment of indecision at the peak. The third candle is a long bearish candle that opens with a gap down, below the low of the Doji, and closes deep within the body of the first bullish candle. The isolated Doji signifies that the bullish momentum has been completely exhausted and abandoned, leading to a swift and powerful reversal to the downside.
- Meaning: A very powerful bearish reversal pattern.
- Where it is found: At the absolute peak of an uptrend.
27. The Tri-Star Doji
The Tri-Star Doji is a rare reversal pattern formed by three consecutive Doji candles. The appearance of a single Doji signals indecision, so the appearance of three in a row represents a moment of extreme market uncertainty and a complete exhaustion of the current trend. The middle Doji is typically a Star, meaning it gaps above or below the previous Doji. A Bullish Tri-Star forms at the bottom of a downtrend, signaling the end of selling pressure. A Bearish Tri-Star forms at the top of an uptrend, signaling the end of buying pressure. Because this pattern indicates such profound indecision, traders almost always wait for the next candle for confirmation before acting on the signal.
- Meaning: A significant reversal pattern (either bullish or bearish) that signals extreme market indecision and trend exhaustion.
- Where it is found: At the top of an uptrend or the bottom of a downtrend.
28. The Deliberation Pattern (Stalled Pattern)
The Deliberation pattern, also known as the Stalled Pattern, is a bearish pattern that suggests an uptrend is losing momentum. It is formed by three consecutive bullish candles at the end of an uptrend. The first two candles are long-bodied bullish candles, showing strong upward momentum. However, the third candle is also bullish but has a very small real body (often resembling a Spinning Top or a small Hammer) that opens with a gap up but fails to make significant upward progress. This “stalling” action on the third day indicates that the buyers are becoming exhausted and are no longer strong enough to push prices significantly higher, even after a gap up. This hesitation or deliberation by the bulls warns that the trend’s power is fading and a reversal may be near.
- Meaning: A bearish pattern that signals the potential end of an uptrend due to waning momentum.
- Where it is found: Near the top of an uptrend.
29. The Three Outside Up
The Three Outside Up is a three-candle bullish reversal pattern that provides stronger confirmation than a standard Bullish Engulfing pattern. The first two candles form a Bullish Engulfing pattern (a small bearish candle followed by a large bullish candle that engulfs it). The third candle is another bullish candle that closes at a new high, above the close of the second candle. This third candle acts as a confirmation of the bullish reversal. It shows that the buying pressure seen in the engulfing candle has continued, solidifying the new uptrend and giving traders more confidence in the reversal signal.
- Meaning: A confirmed bullish reversal pattern.
- –Where it is found: At the bottom of a downtrend.
30. The Three Outside Down
The Three Outside Down is the bearish counterpart to the Three Outside Up and is a confirmed bearish reversal pattern. It begins with a Bearish Engulfing pattern at the top of an uptrend (a small bullish candle engulfed by a large bearish candle). This is followed by a third candle that is also bearish and closes at a new low, below the close of the second candle. The third candle confirms that the bearish momentum from the engulfing pattern is continuing and that sellers have firmly taken control of the market. This pattern provides a more reliable signal of a top than the two-candle Bearish Engulfing pattern alone.
- Meaning: A confirmed bearish reversal pattern.
- Where it is found: At the top of an uptrend.
31. The Rising Three Methods
The Rising Three Methods is a bullish continuation pattern. It occurs during an uptrend and signals that, despite a period of selling, the bulls are still in control. The pattern consists of five candles. It begins with a long bullish candle. This is followed by three small bearish candles that trade within the range of the first bullish candle’s body (they move down but do not close below the first candle’s low). The fifth and final candle is another long bullish candle that closes at a new high, above the close of the first candle. This pattern shows that the three bearish days were merely a pause or a minor pullback in a strong uptrend and that the original bullish trend is now resuming.
- Meaning: A bullish continuation pattern indicating a pause, not a reversal, in an uptrend.
- Where it is found: During a clear uptrend.
32. The Falling Three Methods
The Falling Three Methods is the bearish counterpart and signals the continuation of a downtrend. The pattern is formed by five candles. The first candle is a long bearish candle. This is followed by three small bullish candles that trade within the range of the first candle (they move up but do not close above the first candle’s high). The final candle is another strong bearish candle that closes at a new low, below the close and low of the first candle. This pattern indicates that the three days of buying pressure were weak and insufficient to reverse the trend. The final bearish candle confirms that the sellers have reasserted their control and the downtrend is continuing.
- Meaning: A bearish continuation pattern indicating a brief pause in a strong downtrend.
- Where it is found: During a clear downtrend.
33. The On Neck Line
The On Neck Line is a two-candle bearish continuation pattern that occurs during a downtrend. The first candle is a long-bodied bearish candle. The second candle is a small-bodied bullish candle that opens with a gap down but then rallies to close at or very near the closing price of the previous bearish candle. The fact that the buyers could only push the price back to the previous session’s close, and not into its real body, is a sign of significant weakness. It shows an inability to create a meaningful rally, suggesting that the prevailing downtrend will likely continue.
- Meaning: A bearish continuation pattern.
- Where it is found: During a downtrend.
34. The Thrusting Line
The Thrusting Line is a continuation pattern that can be either bearish or bullish depending on the context, but is more often considered bearish in a downtrend. It is similar to the On Neck Line but slightly stronger for the bulls. In a downtrend, the pattern starts with a long bearish candle. The second candle is a bullish candle that opens below the previous low but then closes into the body of the first candle, but still below its midpoint. While this shows more buying strength than the On Neck Line, the failure of the buyers to push the price above the midpoint of the previous day still signals that the bears are in control and the downtrend is likely to resume.
- Meaning: Primarily a bearish continuation pattern in a downtrend.
- Where it is found: During a downtrend.
35. The Kicking Pattern
The Kicking pattern is a very rare but extremely powerful reversal signal that can be either bullish or bearish. It is formed by two Marubozu candles of opposite colors, with a significant gap between them. A Bullish Kicking pattern consists of a Bearish Marubozu followed by a Bullish Marubozu that opens with a gap up. A Bearish Kicking pattern consists of a Bullish Marubozu followed by a Bearish Marubozu that gaps down. The gap signifies a sudden, violent, and complete shift in market sentiment. There is no overlap in the trading ranges of the two candles, showing a decisive change in control.
- Meaning: A very strong reversal pattern, either bullish or bearish, depending on the direction of the gap.
- Where it is found: Can occur at the top or bottom of a trend.
Of course. Here are two new sections covering the importance of timeframes and frequently asked questions, based on the provided “Candlestick Trading Bible” and general trading knowledge.
Best Timeframes for Candlestick Trading
Choosing the right timeframe is a critical skill that directly impacts the effectiveness of your candlestick analysis. While patterns can appear on any chart, from one minute to one month, price action trading works best on bigger timeframes. The primary timeframes for a price action trader are typically the 1-Hour (1H), 4-Hour (4H), and Daily charts.
Trading on smaller timeframes, such as the 5-minute chart, is generally not recommended because they contain a lot of “noise” from the constant battle between buyers and sellers, which can generate many false signals.
The most effective approach is to use
Top-Down Analysis. This method involves starting with a larger timeframe to get the “big picture” and then drilling down to your preferred, smaller timeframe to look for specific entry signals.
How top-down analysis works:
- Start with a Higher Timeframe (e.g., Weekly or Daily): First, you analyze the higher timeframe chart to gather crucial information.
- Identify the Market Structure: Determine if the market is in a clear uptrend, a downtrend, or if it is a ranging or choppy market. This tells you what the big players and institutional traders are likely doing.
- Find Key Levels: Locate the most important horizontal support and resistance levels. These are major turning points where price is likely to react.
- Check the Previous Candle: The last weekly or daily candle can provide valuable clues about the market’s momentum and potential direction for the coming periods.
- Move to Your Primary Timeframe (e.g., 4H or 1H): After establishing the overall context, you switch to your main trading chart to look for an entry signal.
- Confirm the Market Condition: Check the structure on this timeframe.
- Look for a Price Action Signal: This is where you look for a high-probability candlestick pattern, such as a Pin Bar (Hammer), Engulfing Bar, or Inside Bar, that has formed at one of the key levels you identified.
By using this multi-timeframe approach, you can avoid taking low-probability trades. For example, a bullish pin bar on the daily chart might look like a great buy signal. However, if your top-down analysis shows it has formed just below a major weekly resistance level, you would know it’s a very risky trade that is likely to fail. The higher timeframe context almost always dominates signals on a lower timeframe.
Frequently Asked Questions (FAQs)
1. How reliable are candlestick patterns?
Candlestick patterns can have a high predictive value, but it’s crucial to remember that no single pattern is a “holy grail” that works 100% of the time. You must be prepared to lose some trades, as losing is a part of the game. The reliability of a pattern increases dramatically when you trade it within the right context—that is, when it appears at a key market level and aligns with the overall trend.
2. Do I need to memorize all 35 patterns?
While it’s beneficial to recognize many patterns, it is far more important to deeply understand the psychology behind the most powerful and common ones, such as the Pin Bar (Hammer/Shooting Star), Engulfing Bar, and Inside Bar (Harami). The goal is not just to memorize shapes, but to learn how to read the language of the market to understand what traders are doing and why.
3. Can I use candlestick patterns alone to trade?
You should not rely on candlestick patterns alone. They are flexible and are best used in combination with other technical analysis tools to confirm a signal. The most effective approach is to look for a “confluence” of factors, where a clear candlestick signal forms at a significant level (like support/resistance, a moving average, or a Fibonacci level) and aligns with the market trend.
4. Does the color of a candlestick’s body matter?
Yes, the color is very important as it tells you who won the session. A bullish (white/green) candle means the price closed above the open, while a bearish (black/red) candle means the price closed below the open. For some patterns, like the Engulfing Bar, opposite colors are a requirement. For others, like the Hammer, the long wick is the most critical feature, but a bullish-colored body makes the signal even stronger.
5. What is the most important thing to learn about candlesticks?
The single most important aspect to learn is the market psychology behind why a pattern formed. If you can understand the story of the battle between buyers and sellers that a candlestick tells, you will be able to better predict what is likely to happen next and make well-informed trading decisions.
6. What is the difference between a Pin Bar, a Hammer, and a Shooting Star?
In “The Candlestick Trading Bible,” aPin Bar is the general name for a candlestick with a very long tail (shadow or wick) and a small real body, indicating price rejection. The
Hammer and Shooting Star are specific types of Pin Bars:
- A Hammer is a bullish pin bar that appears at the bottom of a downtrend.
- A Shooting Star is a bearish pin bar that appears at the top of an uptrend.