|

Trading the ICT Turtle Soup Pattern

ict turtle soup pattern

The ICT Turtle Soup Pattern is a significant concept in the realm of Inner Circle Trading (ICT). This trading strategy is renowned for its potential to identify profitable trading opportunities in various market conditions. By understanding this pattern, traders can enhance their market analysis skills, improve their decision-making, and increase their chances of success in the financial markets. In this article, we will delve deep into the ICT Turtle Soup Pattern, exploring its definition, workings, and practical applications to help you become a more informed and strategic trader.

What is the ICT Turtle Soup Pattern?

The ICT Turtle Soup Pattern is a reversal trading strategy designed to capture price movements when the market is poised to reverse. This pattern was popularized by Inner Circle Trading and is particularly effective in identifying short-term trading opportunities.

Definition of the Turtle Soup Pattern

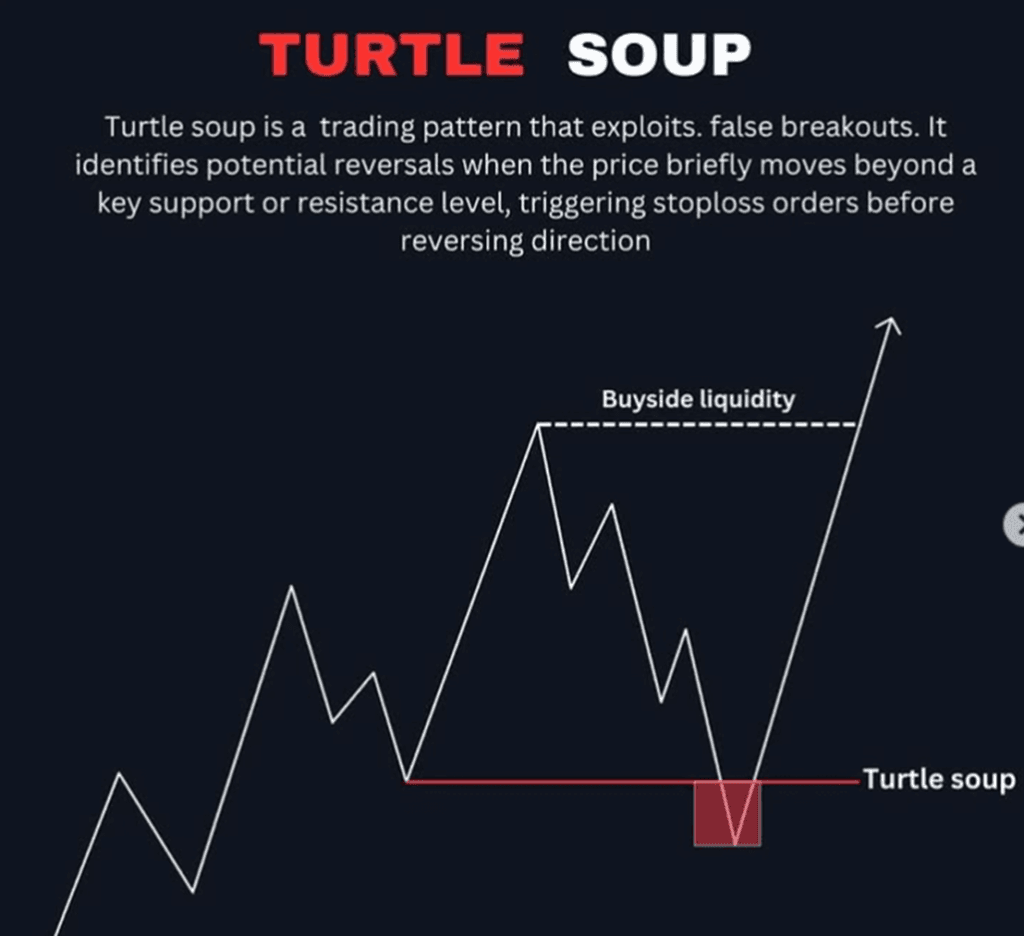
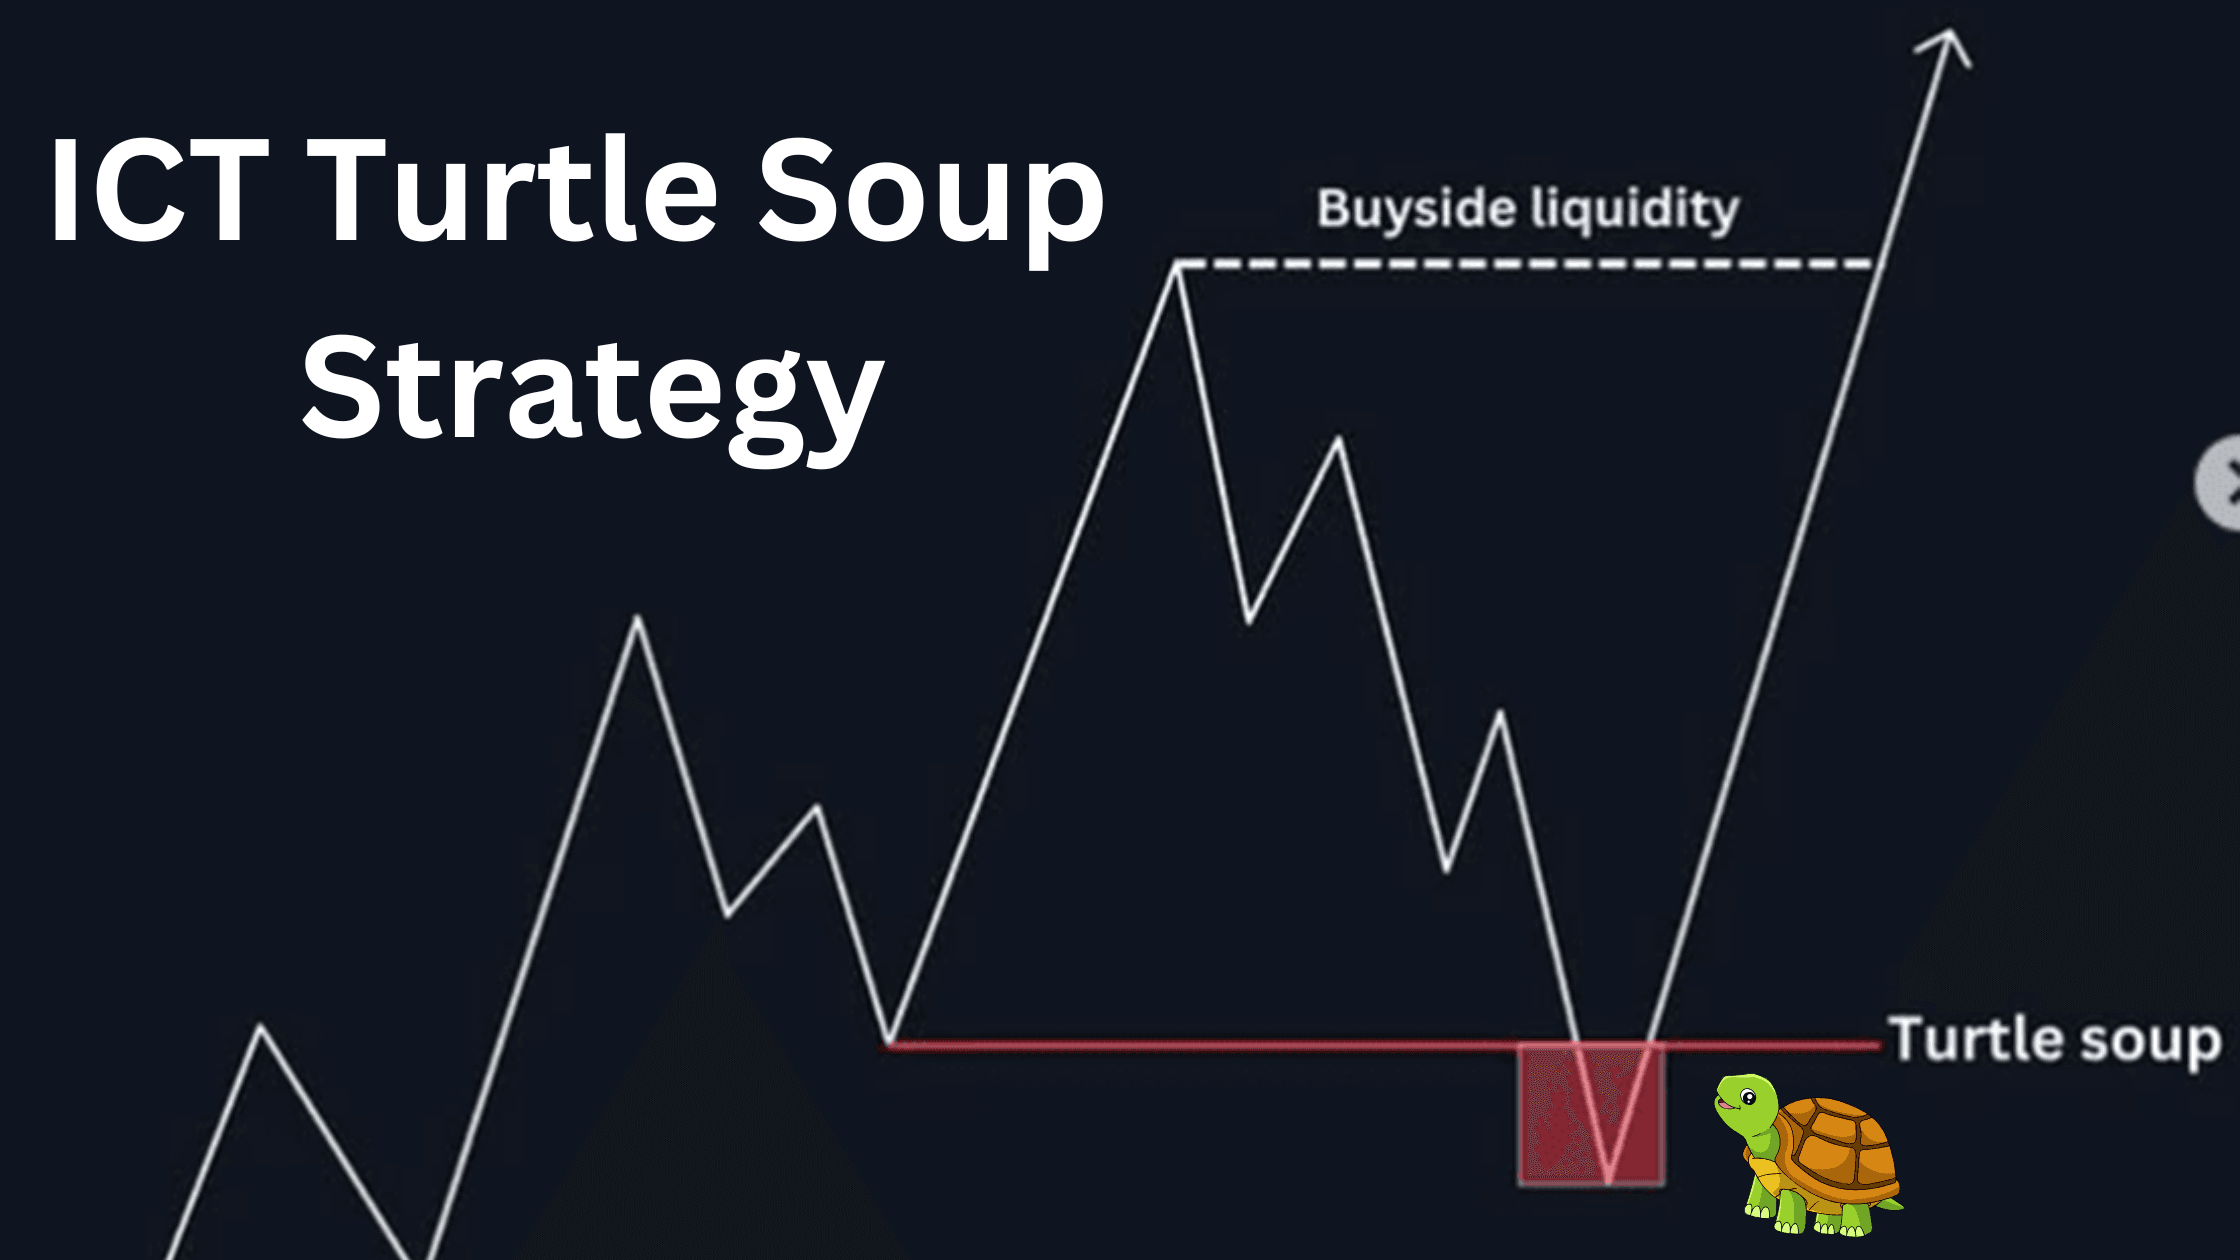
At its core, the Turtle Soup Pattern is a price action strategy that involves two main components: entry points and stop-loss levels. The pattern aims to take advantage of false breakouts, where the price moves beyond a significant support or resistance level but quickly reverses direction.

Traders look for specific conditions to establish whether a Turtle Soup Pattern is forming, such as:

  • A price breakout above the previous high or below the previous low.
  • A subsequent price retracement that sets the stage for a potential reversal.

Historical Background

The name “Turtle Soup” is derived from the legendary Turtle Traders, a group of traders trained in the late 1980s by Richard Dennis and William Eckhardt. The Turtle Traders were taught to follow a set of rules for trading, and one of those strategies involved identifying market reversals. The Turtle Soup Pattern reflects the idea that sometimes, what appears to be a significant price movement can lead to a quick reversal, akin to the concept of “making soup” from the initial breakout.

Components of the Pattern

  1. Entry Point: Traders enter a position after confirming the reversal signals post-breakout. This could be through the use of candlestick patterns or specific technical indicators.
  2. Stop-Loss Level: A crucial part of the Turtle Soup strategy is setting a stop-loss order just above or below the breakout level. This helps protect against losses in case the market continues in the breakout direction instead of reversing.
  3. Target Levels: The profit target can vary based on market conditions, but traders typically aim for a risk-reward ratio of at least 1:2.

How the ICT Turtle Soup Pattern Works

The ICT Turtle Soup Pattern is designed to capitalize on price reversals in the market, making it a powerful tool for traders seeking to maximize their profits. Here’s how this pattern works:

Understanding Market Conditions

The Turtle Soup Pattern typically forms in response to false breakouts. These occur when the price moves significantly above a previous high or below a previous low, creating a sense of momentum. However, this movement is often short-lived, leading to a reversal back in the opposite direction. Recognizing the right market conditions is crucial for successfully trading this pattern.

  1. Trend Context: The pattern is most effective when the market is in a clear trend, either upward or downward. Traders should look for a breakout that occurs near the peak or trough of a price movement.
  2. Reversal Signals: After a breakout, traders should watch for specific reversal signals, such as candlestick formations that indicate a change in sentiment. Common signals include doji candles, engulfing patterns, and pin bars.

Setting Up the Trade

Once the conditions are met and a potential Turtle Soup Pattern is identified, traders can set up their trades:

  • Entry Point: Traders typically enter a position after confirming the reversal signal, usually after the price has retraced slightly from the breakout level.
  • Stop-Loss Placement: To mitigate risk, a stop-loss order is placed just beyond the breakout level. This protects the trader from significant losses if the market continues in the breakout direction instead of reversing.
  • Target Levels: Traders often set profit targets based on a risk-reward ratio. A common approach is to aim for a ratio of at least 1:2, meaning the potential profit is twice the potential loss.

How to Identify the ICT Turtle Soup Pattern

Identifying the ICT Turtle Soup Pattern involves a systematic approach to analyzing price action and market conditions. Here are the steps to help you recognize this pattern effectively:

Step-by-Step Identification Process

  1. Monitor Price Levels: Begin by observing significant support and resistance levels on the chart. These levels are crucial as the Turtle Soup Pattern often occurs near these points. Use horizontal lines to mark previous highs and lows.
  2. Look for Breakouts: Watch for price action that breaks above a resistance level or below a support level. This breakout is the first indication that a Turtle Soup Pattern may be forming.
  3. Check for Retracement: After the breakout, the price should retrace back toward the breakout level. This retracement is essential as it sets the stage for the potential reversal.
  4. Identify Reversal Signals: Look for specific candlestick patterns that signal a reversal. Effective reversal patterns include:
  5. Doji: Indicates indecision in the market.
  6. Engulfing Pattern: A larger candle that engulfs the previous candle, suggesting a change in momentum.
  7. Pin Bar: A candle with a long wick, signaling rejection of a price level.
  8. Confirm with Indicators: Traders often use additional indicators, such as Relative Strength Index (RSI) or Moving Averages, to confirm the reversal. For instance, if the RSI indicates overbought or oversold conditions during the retracement, it strengthens the case for a potential Turtle Soup Pattern.

Visualizing the Pattern

Using charting software can significantly aid in identifying the Turtle Soup Pattern. Consider incorporating the following elements:

  • Draw Support and Resistance Lines: Clearly mark the key levels on your charts.
  • Highlight Breakout and Retracement Zones: Use colored markers or arrows to illustrate the breakout and subsequent retracement areas.

How to Use the ICT Turtle Soup Pattern in Trading

Imagine you’re a trader, observing the market closely as the price approaches a significant resistance level. The price suddenly breaks above that level, creating excitement in the market, with many traders rushing to buy. However, you’ve studied the ICT Turtle Soup Pattern and know that breakouts can sometimes be traps. Instead of jumping in with the crowd, you wait.

As expected, the price starts to retrace. This is the moment you’ve been waiting for. You’ve identified a potential Turtle Soup setup. Here’s how you can use this pattern to your advantage:

Entry Point

You patiently wait for the price to pull back below the breakout level. Once the price retraces and shows signs of reversing back below the previous high (if it was a bullish breakout), you enter a short position. Conversely, for a bearish breakout that reverses, you would go long when the price moves back above the previous low.

At this point, you’re positioning yourself against the initial breakout, anticipating that the market will reverse in your favor. This contrarian strategy often works because the false breakout traps impatient traders, forcing them to exit their positions as the price reverses.

Set Stop-Loss Orders

No trading strategy is complete without a solid risk management plan. In this case, your stop-loss order should be placed just beyond the original breakout level. If the price does not reverse as anticipated and instead continues in the direction of the breakout, the stop-loss will limit your losses. For example, if you’re shorting after a false bullish breakout, set the stop-loss slightly above the high that was broken. This way, your risk is controlled.

Define Profit Targets

After entering the trade and securing your stop-loss, the next step is determining your profit target. One common method is to use a risk-to-reward ratio. For instance, a 1:2 ratio means you’re willing to risk one dollar for every two dollars of potential profit. You can set your target at a previous support or resistance level, depending on the direction of the reversal.

In practice, many traders also use technical indicators, such as moving averages or Fibonacci retracement levels, to identify logical exit points for their trades. By combining these tools with the Turtle Soup Pattern, you give yourself a higher probability of success.

Monitor and Adjust

Once you’ve entered the trade, it’s essential to monitor price action and be prepared to adjust your stop-loss or exit the trade early if market conditions change. Sometimes the market can offer signs of an extended move, allowing you to lock in additional profits by trailing your stop-loss as the price moves in your favor.

This dynamic approach to using the ICT Turtle Soup Pattern allows traders to capitalize on false breakouts with precision, protecting their positions while aiming for high-reward scenarios.

Conclusion

The ICT Turtle Soup Pattern is a powerful tool in the world of Inner Circle Trading, enabling traders to take advantage of market reversals triggered by false breakouts. By patiently identifying the pattern, setting up the right entry points, and managing your risk with well-placed stop-losses, you can position yourself to capitalize on these trading opportunities.

Like any strategy, the Turtle Soup Pattern requires practice and a clear understanding of market dynamics. It’s important to test it in various market conditions, such as demo trading, before applying it with real capital. Over time, with consistent practice, traders can develop a keen eye for identifying these setups, improving their decision-making and trading performance.

In conclusion, mastering the ICT Turtle Soup Pattern allows you to trade with confidence, knowing that you have a well-thought-out strategy to protect against false breakouts while maximizing your potential returns.

Read More ICT Advanced Market Structure

Frequently Asked Questions

What is the ICT Turtle Soup Pattern?

The ICT Turtle Soup Pattern is a trading strategy that aims to identify potential market reversals following false breakouts. It typically occurs after the price breaks above a resistance level or below a support level, only to quickly reverse direction. This pattern helps traders capitalize on short-term price movements by entering trades that go against the breakout.

How do I identify the ICT Turtle Soup Pattern?

To identify the ICT Turtle Soup Pattern, look for:

Reversal signals such as candlestick patterns (e.g., dojis, engulfing patterns) that indicate a change in market sentiment.

A significant price breakout above a resistance level or below a support level.

A subsequent retracement back towards the breakout level.

What is the best way to enter a trade using the Turtle Soup Pattern?

The best entry point is when the price retraces back to the breakout level and shows signs of reversal. This is typically confirmed by candlestick patterns or technical indicators that signal a potential change in direction. Enter the trade after these confirmation signals appear.

How should I set my stop-loss when using the Turtle Soup Pattern?

Place your stop-loss order just beyond the breakout level. For example, if you enter a short position after a bullish breakout, set your stop-loss slightly above the high that was broken. This helps limit your losses in case the market continues in the direction of the breakout.

Similar Posts

Leave a Reply

Your email address will not be published. Required fields are marked *