What is SMT Divergence in Trading?
In the world of trading, identifying market inefficiencies and predicting price movements are critical skills. what is smt divergence (Smart Money Tool Divergence) is a key concept used by ICT (Inner Circle Trading) practitioners to spot potential market reversals. By understanding how divergence between price action and related market instruments works, traders can position themselves to profit from these shifts. In this article, we will explore what SMT Divergence is and break down its application in ICT trading strategies.
Understanding SMT Divergence in ICT
What is SMT Divergence?
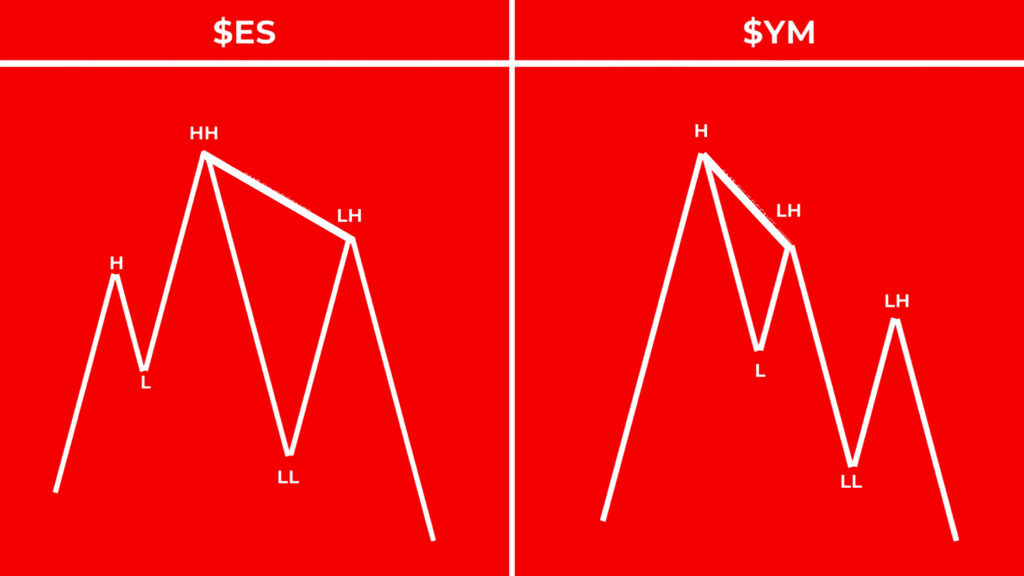
SMT Divergence stands for Smart Money Tool Divergence. It refers to the situation when there is a divergence between price action and a related market instrument, such as another currency pair or an indicator. Divergence occurs when two markets show opposite price movements. In the context of ICT trading, it’s a signal that price manipulation might be happening, which could lead to a potential market reversal.
For example, if one currency pair is making a higher high while another is making a lower high, this discrepancy (divergence) suggests that institutional traders, or smart money, may be controlling the market and manipulating price to their advantage. Understanding this divergence helps traders anticipate when the price is likely to reverse or retrace, which can be a lucrative opportunity for entering or exiting trades.
In ICT (Inner Circle Trading), SMT Divergence is viewed as a tool to identify liquidity grabs and market manipulation. It highlights instances when price and related market indicators don’t align, often signaling that the market is preparing for a shift. This understanding allows traders to predict price movements with higher accuracy, offering an edge over retail traders who might miss these crucial signs.
How SMT Divergence Works in ICT Trading
In ICT trading, SMT Divergence works as a powerful tool to identify when smart money is positioning itself in the market. It often indicates that institutional traders are manipulating the market by creating false trends in order to accumulate or distribute positions before a price reversal.
For instance, when price action shows a strong upward move, but an indicator or a related currency pair shows weakness (divergence), it suggests that the upward movement is unsustainable. Traders can use this information to anticipate reversals and make informed decisions based on market structure and liquidity.
Key Concepts Related to SMT Divergence
Market Structure
In ICT trading, understanding market structure is vital when analyzing SMT Divergence. Market structure refers to the overall movement of price in the market, which can be classified into different phases, such as bullish, bearish, or neutral. A market structure is typically identified by higher highs and higher lows in an uptrend or lower highs and lower lows in a downtrend.
When SMT Divergence occurs, it is often a sign that the market structure is about to shift. For example, if the price is making new highs, but a related currency pair or indicator is not, it suggests that the current uptrend might not be supported by smart money. Therefore, traders can use SMT Divergence as an early warning signal of an impending change of character or break of structure. Understanding these shifts is essential to anticipate price action and make accurate trade decisions.
Incorporating market structure into your analysis of SMT Divergence helps you filter out false signals. For instance, a divergence that happens in the middle of a strong trend may not lead to a reversal. However, when divergence occurs after a clear market structure shift, it can be more reliable and signal an impending change in price direction.
Liquidity and Smart Money
In ICT trading, liquidity is a crucial factor when interpreting SMT Divergence. Liquidity refers to the ability to buy or sell an asset without causing a significant change in its price. Institutional traders, also known as smart money, tend to operate in large volumes and manipulate liquidity to their advantage.
SMT Divergence is closely related to liquidity because divergence often occurs when there is an imbalance in supply and demand. When smart money manipulates liquidity, it can create artificial trends that lead retail traders to enter the market, only for the price to reverse once those positions are filled. By identifying SMT Divergence, traders can understand when smart money is likely accumulating positions, and they can align their trades accordingly.
In the context of ICT, liquidity manipulation is often a precursor to price reversal. If there is a divergence between price action and a related market, and the market has been accumulating or distributing liquidity, this is a strong indication that the price is about to change direction. Understanding buy-side liquidity and sell-side liquidity is key to identifying the potential impact of SMT Divergence on future price movement.
Conclusion of Content So Far: The article provides an in-depth understanding of SMT Divergence and its connection with ICT trading principles, such as market structure and liquidity. By recognizing SMT Divergence, traders can spot potential market reversals and better predict price movements, giving them an edge in smart money trading strategies.
Recognizing SMT Divergence in ICT Trading
Identifying Divergence Between Pairs
Recognizing SMT Divergence in ICT trading involves comparing the price action of two related instruments, typically currency pairs or market indicators. The key is to spot when one instrument (like a currency pair) moves in one direction, while a related instrument behaves differently. For example, you might notice that EUR/USD is making a higher high, but GBP/USD is making a lower high. This opposite movement between the two pairs signals a potential divergence.
The ICT approach to identifying SMT Divergence relies heavily on understanding smart money manipulation. Divergence can often be spotted during periods of market manipulation, where institutional players are accumulating or distributing positions. A strong uptrend in one pair with a weaker or conflicting trend in another pair can suggest that the price is likely to reverse once the smart money has completed its market operations.
For traders, identifying SMT Divergence is crucial to avoid falling for false trends and to spot the likely reversal points. By looking for opposite price movements between correlated instruments, traders can gain an insight into potential price manipulation and position themselves accordingly.
SMT Divergence on Different Timeframes
SMT Divergence can appear on various timeframes, and the time frame you choose can affect how you interpret the divergence. On shorter timeframes, the divergence may indicate a short-term price correction, while on longer timeframes, it can signal a more substantial market reversal or a break of structure. For example, if you notice SMT Divergence on a 15-minute chart, it might suggest a short-term trade, while a divergence on a 4-hour or daily chart could indicate a more significant shift in the market.
Traders in ICT often use higher timeframes to identify major trends and market structure shifts, while shorter timeframes are useful for pinpointing entry points. By recognizing SMT Divergence on multiple timeframes, traders can gain a more complete understanding of the market’s potential direction and adjust their trades accordingly. A divergence on a higher timeframe is often considered more reliable and is typically followed by a larger market move.
In ICT trading, it’s also important to combine SMT Divergence with other techniques, such as optimal trade entry (OTE), order blocks, or liquidity voids, to confirm the signal. This additional confirmation ensures that you’re not trading based solely on divergence but considering other key factors of market structure and liquidity.
Trading Strategies with SMT Divergence in ICT
How to Use SMT Divergence for Market Entries
One of the most powerful ways to use SMT Divergence in ICT trading is to identify trade entries that align with market structure shifts. Divergence often occurs before a market reversal, making it a valuable tool for anticipating market direction.
When SMT Divergence is spotted, traders should wait for a confirmation signal that aligns with their overall trading strategy. For example, once divergence is identified, you can use ICT strategies like Optimal Trade Entry (OTE) to pinpoint the ideal entry point. The OTE strategy involves waiting for a price retracement to a key Fibonacci level, such as the 61.8% level, before entering a trade in the direction of the trend reversal indicated by the divergence.
Additionally, combining SMT Divergence with a break of structure or change of character can help confirm that the market is indeed shifting. For instance, if SMT Divergence occurs at a significant order block and you observe a break of structure following the divergence, this provides a strong confirmation that the market is likely to reverse in the anticipated direction.
Traders can also combine SMT Divergence with liquidity voids, which are areas of the market where price has moved quickly without much resistance. These areas are often targeted by smart money for accumulation or distribution, and when combined with divergence, they offer a powerful opportunity to enter trades at the most opportune moments.
How to Confirm Divergence for Better Accuracy
While SMT Divergence can be a strong signal of a market reversal, it’s essential to confirm it with additional tools to avoid false signals and improve trading accuracy. In ICT trading, confirmation can come from several key areas:
- Market Structure: Before acting on divergence, ensure the market structure aligns with the potential reversal. If a higher high is made in price, but a related instrument shows weakness, you may be witnessing divergence signaling an upcoming shift. However, this should be validated by a clear shift in market structure, such as a break of structure.
- Fibonacci Retracement: After identifying SMT Divergence, use Fibonacci retracement levels to find areas where price is likely to retrace before continuing in the new direction. The 61.8% Fibonacci level is particularly significant in ICT trading as it often serves as a point where institutional traders may place liquidity grabs before price continues in the direction of the trend reversal.
- Breaker Blocks and Rejection Blocks: Another excellent tool for confirming SMT Divergence is the use of Breaker Blocks and Rejection Blocks. A Breaker Block is a significant price level where the market breaks a previous level of support or resistance, often leading to a reversal. A Rejection Block occurs when price is rejected from a significant level, indicating that the market is likely to reverse. These blocks, when combined with divergence, add further credibility to the potential trade setup.
- Liquidity Voids: As SMT Divergence signals potential smart money manipulation, it’s also important to watch for liquidity voids — areas where price has moved quickly without creating much trading activity. When SMT Divergence occurs near a liquidity void, this often signifies that smart money is preparing to fill the void and reverse the market.
Conclusion
Using SMT Divergence in ICT trading provides traders with the insight needed to predict market shifts and capitalize on price reversals. By recognizing divergence between related instruments, confirming the signal with ICT strategies like Fibonacci retracement, order blocks, and liquidity voids, and understanding market structure, traders can gain a significant edge. However, always ensure that SMT Divergence is confirmed by additional ICT tools to avoid false signals and make more accurate trading decisions.
Common Mistakes When Using SMT Divergence
1. Ignoring Confirmation Signals
One of the most common mistakes traders make when using SMT Divergence in ICT trading is ignoring confirmation signals. Divergence alone is not enough to make a reliable trading decision. Many traders jump into trades simply because they spot a divergence between two correlated instruments, without waiting for additional confirmation signals like a break of structure, order blocks, or Fibonacci retracement levels.
In ICT trading, confirmation is key. Divergence may indicate a potential reversal, but if the market structure doesn’t support it, the reversal may not happen as expected. For example, if you spot SMT Divergence between EUR/USD and GBP/USD, but the EUR/USD is still in an uptrend with no clear break of structure, the signal may be weaker. Without confirmation, entering the trade could result in losses.
2. Not Considering Market Conditions
Another mistake traders often make is failing to consider overall market conditions. SMT Divergence can be more significant in trending markets, but in sideways or choppy markets, the divergence might not lead to a substantial price move. In volatile or ranging markets, divergence may just be a short-term correction or false signal.
Before acting on SMT Divergence, always assess the broader market structure. If the market is in a strong trend, divergence can be a more reliable signal for a reversal. But in a consolidation phase, the divergence might not indicate a real change in market direction. Using ICT techniques such as market bias analysis can help determine if the market conditions are conducive to a successful trade based on divergence.
3. Overtrading Divergence Signals
Some traders make the mistake of overtrading SMT Divergence by taking every divergence signal that appears. While divergence is a powerful tool, it should not be used as the sole basis for trading. Overtrading can occur when traders act on every instance of divergence without considering other factors like price action, market structure, and liquidity conditions.
It’s important to develop a disciplined approach when trading SMT Divergence. Focus on higher-quality signals and wait for confirmation. For instance, look for divergence at key support and resistance levels or near significant order blocks. This improves the probability of a successful trade and reduces the risk of losses from false signals.
4. Misunderstanding Divergence Direction
Misinterpreting the direction of the SMT Divergence is another common mistake. Divergence can occur when prices move in the opposite direction of an indicator or between two correlated pairs, but this doesn’t always indicate a reversal. Traders may wrongly assume that divergence always signals a trend change, but sometimes it can simply be a pullback or retracement within a larger trend.
For instance, if GBP/USD is making lower lows while EUR/USD is making higher highs, the trader might incorrectly interpret this as a signal to go short on EUR/USD. However, if EUR/USD is still in a strong uptrend, the divergence may just be part of a temporary pullback. Always consider the larger trend before interpreting SMT Divergence as a signal for a reversal.
5. Not Accounting for Market Manipulation
In ICT trading, it’s crucial to understand that smart money (institutions) can create false signals, manipulating the market to shake out retail traders. SMT Divergence can sometimes be a result of manipulation, especially during periods of high liquidity or when the market is consolidating. Traders may misinterpret these artificial price movements as a signal of an impending reversal, only to be caught in a false breakout.
Traders should be aware of the potential for market manipulation and not rely solely on SMT Divergence. It’s important to combine divergence with other ICT tools like order blocks, liquidity voids, and market structure to confirm the validity of the signal.
Practical Example of SMT Divergence in ICT Trading
Divergence Between EUR/USD and GBP/USD
Let’s look at a practical example of SMT Divergence using two correlated currency pairs: EUR/USD and GBP/USD. Suppose you are observing EUR/USD in an uptrend, with price making higher highs. At the same time, GBP/USD is showing lower highs, suggesting a divergence between the two pairs. This is a classic example of SMT Divergence, as the two pairs should typically move in the same direction in a strong market trend.
Now, to confirm this divergence, you check the market structure on both pairs. If EUR/USD has reached a significant order block or key Fibonacci level, and you see a break of structure on GBP/USD, it’s a strong indication that the EUR/USD pair might reverse or consolidate, and GBP/USD might continue in its trend.
After confirming the divergence and structural shifts, you can enter a long position on EUR/USD, expecting a potential retracement or trend reversal. You could also place a stop loss just below the recent swing low to manage your risk.
SMT Divergence on Gold and US Dollar Index
Another example involves the Gold market and the US Dollar Index (DXY). Gold and the US Dollar are often inversely correlated, meaning when the dollar strengthens, gold tends to weaken and vice versa. Suppose that Gold is making a higher high, but the US Dollar Index is making a lower high at the same time. This is another case of SMT Divergence.
In this scenario, you would use ICT techniques such as liquidity voids and Fibonacci levels to confirm the divergence. If Gold has reached a key liquidity zone while the Dollar Index has broken structure, this could signal that Gold is ready to reverse its upward movement, while the US Dollar may continue to strengthen.
Traders can use this information to set up a short position on Gold or a long position on the US Dollar Index, depending on the confirmed direction of the market.
Conclusion
In ICT trading, recognizing and correctly applying SMT Divergence can provide significant advantages, especially when used alongside other trading tools like market structure analysis, Fibonacci retracement, and liquidity voids. However, traders must avoid common mistakes such as ignoring confirmation signals, overtrading, or misinterpreting divergence direction.
By carefully analyzing divergence, confirming with other ICT techniques, and understanding the broader market context, traders can enhance their decision-making process and improve their chances of successful trades.
Conclusion
In ICT trading, SMT Divergence is a powerful tool that traders use to identify potential market reversals or shifts in momentum between two correlated instruments. Understanding how to spot and interpret SMT Divergence correctly is essential for improving trading accuracy and making more informed decisions. While SMT Divergence can offer valuable insights, it is crucial to remember that it should not be used in isolation. Always confirm divergence signals with other ICT tools such as market structure, order blocks, and Fibonacci retracement levels to ensure higher probability trades.
Avoiding common mistakes like ignoring confirmation signals, overtrading, and misinterpreting divergence direction can significantly enhance your trading results. By practicing and refining your understanding of SMT Divergence in different market conditions, you will be able to trade with greater confidence and precision.
To sum up, SMT Divergence is an important concept in ICT and can help you identify key moments when the market is likely to reverse or consolidate. Combining this technique with other ICT principles will allow you to maximize the potential of your trades and better manage risk.
Read more ICT Fibonacci Levels-A Trader’s Guide
Frequently Asked Questions
What is SMT Divergence in ICT Trading?
SMT Divergence (Smart Money Technique Divergence) in ICT trading refers to the situation where two correlated instruments (like currency pairs or commodities) show opposing price movements, signaling a potential shift in market direction. It’s used to spot reversals or pullbacks in the market.
How do I spot SMT Divergence?
To spot SMT Divergence, you need to monitor two correlated instruments, such as EUR/USD and GBP/USD. If one pair is making higher highs while the other is making lower highs, this indicates a divergence. Confirm the divergence by checking the market structure, order blocks, and key support/resistance levels.
What are the common mistakes to avoid when using SMT Divergence?
Some common mistakes to avoid when using SMT Divergence include:
- Ignoring confirmation signals from other indicators
- Overtrading every divergence signal
- Misunderstanding the direction of divergence
- Not considering market conditions or market manipulation
- By being aware of these mistakes and using ICT techniques like market bias and order blocks, you can avoid false signals and improve your trading accuracy.
How can I practice using SMT Divergence in ICT Trading?
To practice using SMT Divergence, start by analyzing correlated currency pairs or assets. Monitor their price movements for divergence while also checking other ICT tools like market structure and liquidity zones. Practice identifying these setups on a demo account to refine your skills before applying them in live trading.