The ICT Opening Range Gap (ORG) refers to the price difference between today’s market open and yesterday’s close. This gap often acts as a magnet for price action, as the market tends to revisit or partially fill the ORG before making any significant directional move.
What is ICT Opening Range Gap (ORG)?
The Inner Circle Trader Opening Range Gap (ORG) represents the price difference—or “jump”—between the previous day’s close and the current day’s open during Regular Trading Hours (RTH). Specifically, it’s the gap between:
- The first traded price of the new session (typically at 9:30 AM EST), and
- The previous day’s closing price (usually around 4:15 PM EST).
When you switch your chart to display Regular Trading Hours, this gap often becomes more apparent. According to ICT concepts, this open gap acts like a magnet for price—the market tends to revisit or partially fill it before making a strong directional move. As a result, the ORG can serve as a predictable area of interest for potential entries, exits, or reversals.
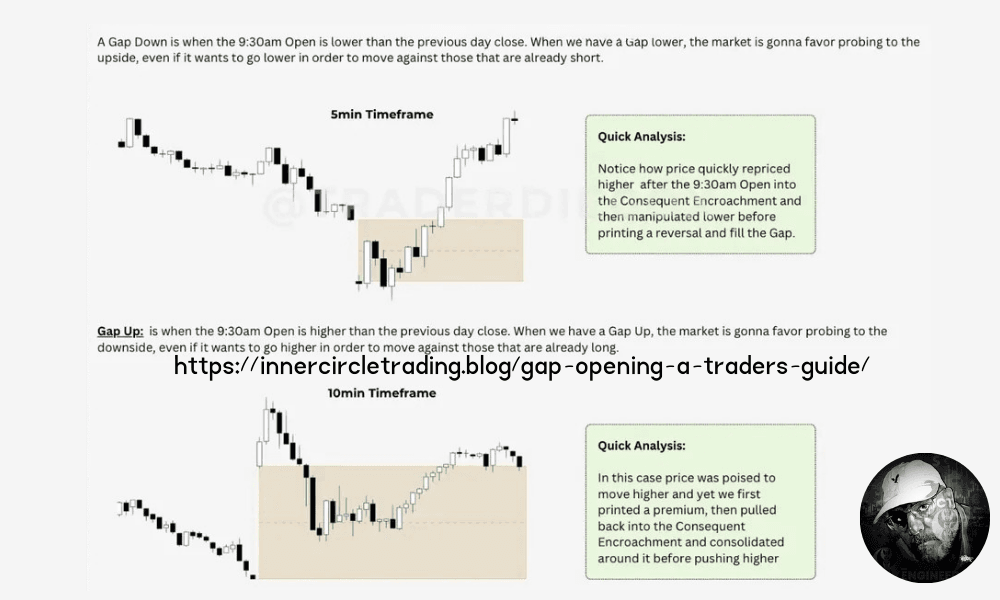
What is Gap UP?
A Gap Up occurs when a stock, index, or any trading instrument opens at a higher price than it closed the day before. In other words, there’s a visible “gap” on the price chart between yesterday’s close and today’s open, with no trading happening in between.
Example:
- Let’s say a stock closes at $100 on Monday.
- On Tuesday, it opens at $105.
- The $5 difference is the Gap Up.
What is a Gap Down?
On the flip side, a Gap Down happens when a stock or index opens at a lower price than its previous closing price. This gap reflects a sudden drop in sentiment, where sellers dominate the market even before regular trading begins.
Example:
- A stock closes at $100 on Thursday.
- On Friday morning, it opens at $95.
- That $5 drop is a Gap Down.
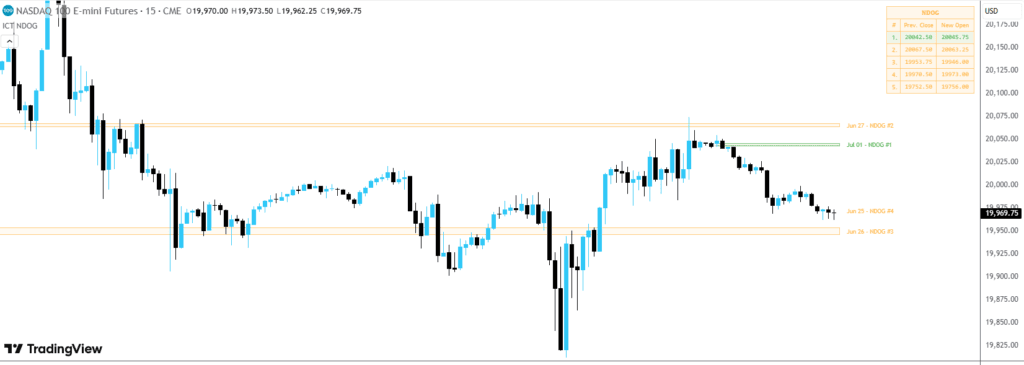
How to Find and Draw the Opening Range Gap
Finding the ORG on your chart is easier than you think:
- Switch to Regular Trading Hours (RTH): Many charting platforms let you change your session type. This cleans up the chart and focuses on the main trading hours.
- Locate Yesterday’s Close: Find the candle that closed at 4:15 PM EST yesterday. Note its closing price.
- Locate Today’s Open: Find the very first candle that opened at 9:30 AM EST today. Note its opening price.
- Draw the Gap: Simply draw a box or lines from yesterday’s close to today’s open. That’s your Opening Range Gap!
Why the Opening Range Gap (ORG) Matters in Trading
The Opening Range Gap (ORG) isn’t just an accidental price difference between sessions—it’s a highly strategic zone that savvy traders watch closely. Here’s why it’s so significant:
1. High-Probability Retracement
According to data from Inner Circle Trader (ICT), there’s roughly a 70% chance that price will retrace at least 50% of the ORG within the first 30 minutes of the trading session (from 9:30 AM to 10:00 AM EST).
For day traders, this presents a high-probability setup for quick, short-term trades early in the day.
2. Key Support and Resistance Zones
Once the gap is filled, don’t just move on. The ORG levels—especially the high (top), low (bottom), and the midpoint (50% level)—often become strong support or resistance zones. These levels can influence price behavior throughout the day, and sometimes even for several days afterward.
3. Clear and Actionable Trade Targets
Drawing the ORG lines on your chart gives you clear structure:
- Defined zones for entries and exits
- Logical profit targets
- Smarter stop-loss placements
This can dramatically improve your trade precision, especially in volatile markets
Fair Value Gap and ICT Opening Range Gap
ICT also talks about the Fair Value Gap (FVG). This is a small gap on your chart where there’s an imbalance in buying or selling. While FVGs can happen anywhere, the first 1-Minute FVG that forms after 9:30 AM EST (specifically, at 9:31 AM EST or later) is extra special.
- Why it matters: The market often seeks to ‘correct’ these tiny FVGs quickly. When this first FVG happens near an ORG level (like the high, low, or midpoint of the ORG), it can be a super powerful signal for a quick trade. It’s like having two confirmations for your entry!
ICT Opening Range Gap Trading Strategy
Step 1: Identify and Mark Key Levels
Right after the market opens at 9:30 AM EST, mark these three key points on your chart:
- Yesterday’s Closing Price
- Today’s Opening Price
- Midpoint (50%) of the ORG
These levels will form the foundation of your ORG strategy.
Step 2: Watch for the 50% Retracement
The first price target is often the 50% midpoint of the gap. Here’s how to trade based on the opening direction:
- If the market opens above yesterday’s close:
Look for a pullback to the midpoint of the ORG. This zone can act as strong support, making it a good potential buy entry. - If the market opens below yesterday’s close:
Watch for a rally toward the midpoint. It may act as strong resistance, providing an opportunity to sell or short.
Step 3: Manage Your Trade
- Once price hits the 50% level, consider taking partial profits.
- If momentum continues toward a full gap fill, trail your stop-loss to lock in gains while allowing the trade to run.
- Always adjust risk management based on market volatility and structure.
If the market opens above the previous day’s close, wait for a dip back to the 50% level. This zone often serves as dynamic support for a potential buy entry, targeting a continuation upward.
If the market opens below the previous day’s close, look for a rally up to the 50% level. This area frequently acts as resistance, offering a solid shorting opportunity, especially if you’re targeting a move toward new lows.
Download ICT Opening Range Gap Strategy PDF
Want to dive deeper and get the full details on trading the Opening Range Gap (ORG) strategy? You can download the complete strategy for trading ORG by clicking on the download button below.
Some FAQs About the Opening Range Gap
What is the Opening Range Gap (ORG)?
It’s the price difference between yesterday’s closing price and today’s opening price of the main trading session (Regular Trading Hours).
Why is the ORG Formed?
It forms because of trading activity that happens between sessions (like overnight news or orders) that aren’t reflected in the main session’s price, leading to a ‘jump’ at the open.
What Time is the ORG Formed?
The ORG is identified at the start of the Regular Trading Hours session, usually at 9:30 AM EST.
What is the Importance of the First 1-Minute FVG After the Open?
The very first Fair Value Gap (FVG) that appears on the 1-minute chart at 9:31 AM EST or later is important because it often represents a quick imbalance that the market tends to correct rapidly. When it aligns with ORG levels, it can provide a precise entry point.