ICT Classic Buy Day Template Explained

In the world of trading, spotting high-probability days can dramatically enhance your trading success. Experienced traders use various techniques to pinpoint when market conditions align for optimal trades. One such strategy is the Classic Buy/Sell Day Template, which combines liquidity analysis with an understanding of session-based market behavior. In this post, we’ll explore how to identify these high-probability trading days and how to trade in sync with the market’s natural movements.
1. Understanding Liquidity Draw
A key concept for identifying high-probability trading days is liquidity draw. Liquidity refers to areas where there are high concentrations of market orders, such as support and resistance zones. These areas act as magnets for price action, drawing the market to them before significant moves take place. By identifying these liquidity zones on higher timeframes (daily or weekly charts), traders can anticipate where the market is likely to move next.
Liquidity draw usually occurs at key market levels where there’s an imbalance in orders. If you can spot these areas, you can position yourself to trade when the market moves toward them, which is when the probability of success is highest.
2. ICT’s Rule: The London Session and Market Extremes
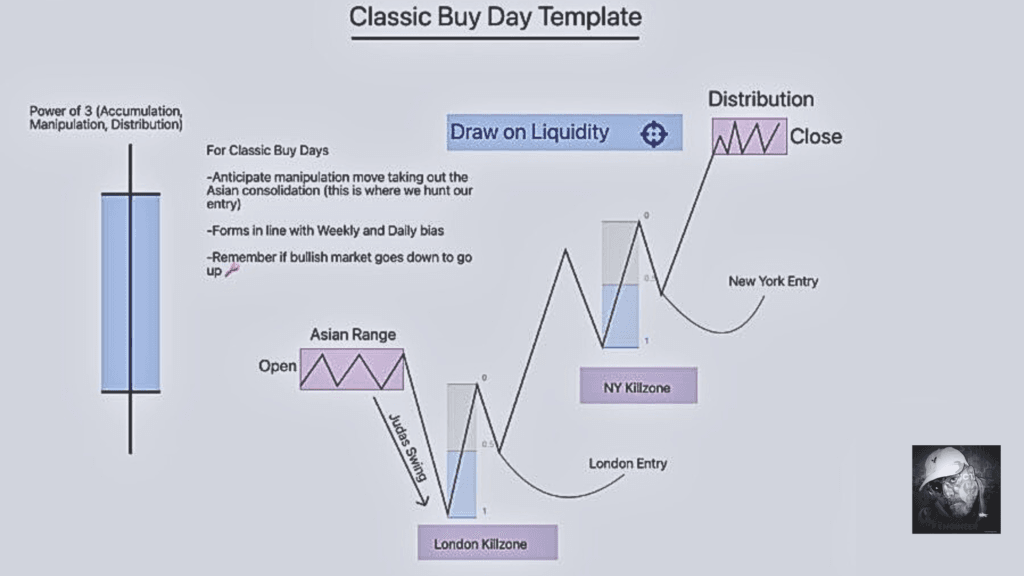
The Inner Circle Trader (ICT) concept suggests that 70% of the time, the London session will make the high or low of the day, especially when the daily bias is correct. This is based on the fact that the London session overlaps with the New York session, leading to significant liquidity and volatility.
Here’s how it works: If the market shows a bullish daily bias, the London session often establishes the low of the day, after which the market moves upward. Conversely, in a bearish market, the London session usually marks the high of the day, followed by a downward price move.
By understanding this pattern, traders can prepare for major price shifts during the London session, aligning their trades with the expected market direction.

3. The Fractal Nature of Price Action
Another powerful concept in trading is the fractal nature of market behavior. Fractals are repeating patterns that occur at different scales across timeframes. What this means for traders is that patterns seen on higher timeframes (e.g., daily or weekly charts) often repeat on smaller timeframes (e.g., 1-minute or 5-minute charts).
For example, you might notice that the same sequence of events—open, manipulation, and true move—appears both on the daily chart and the 1-minute chart. Recognizing this fractal pattern allows traders to predict price movement across various timeframes and increase the likelihood of successful trades.

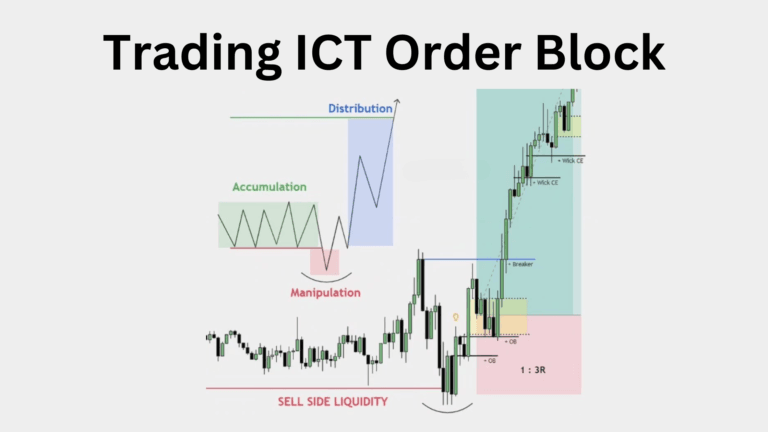
4. Open, Manipulation, and True Move: A Trading Cycle
On short timeframes (like the M1 or 5-minute charts), the market often follows a predictable cycle:
- Market Open: The market establishes an initial price direction.
- Manipulation Phase: The price moves against the prevailing trend, creating false breakouts or inducing stop-losses to trap traders.
- True Move: After the manipulation, the market moves in the predicted direction, aligning with the larger liquidity zone or trend.
Understanding this cycle allows traders to avoid falling into traps during the manipulation phase and position themselves for the true move. If you spot this pattern early, you can maximize your chances of success by entering trades at the most favorable moments.
5. How to Apply These Concepts in Your Trading
Here’s a step-by-step approach to applying these strategies in your trading:
- Identify Liquidity Zones: Use daily and weekly charts to spot key liquidity levels, such as support, resistance, and supply/demand zones.
- Confirm Your Daily Bias: Analyze the daily chart to determine the market’s general trend (bullish or bearish) to establish your bias for the day.
- Watch for the London Session Extremes: Recognize that 70% of the time, the London session will set the high or low of the day if the daily bias aligns.
- Look for Fractal Patterns: Watch for repeating patterns (open, manipulation, true move) across timeframes. These patterns can provide crucial entry signals.
- Execute with Confidence: Once you see the setup align with liquidity zones and the London session dynamics, enter the trade confidently during the true move phase.
By combining liquidity analysis, session timing, and fractal price action, you can spot high-probability trading days and position yourself for success in the market. This approach helps you align your trades with the market’s natural flow, improving your chances of success.

Final Thoughts
Mastering high-probability trading days requires a deep understanding of market behavior, liquidity zones, and session-based dynamics. By applying these principles, you can navigate the markets with greater precision, increasing your chances of making profitable trades. Remember, the key is to trade in line with the market’s natural flow and to identify patterns that repeat across timeframes. This approach will not only help you make better trading decisions but will also boost your overall trading confidence.

Hi, I’m Seojin Lee, an experienced trader focusing on the U.S. stock market, particularly NASDAQ and E-mini S&P futures. As a Chartered Financial Analyst (CFA), I apply my knowledge of financial analysis and market strategies to identify profitable opportunities.
I specialize in both short-term and long-term trading, always balancing risk management with market trends. With years of experience, I continuously refine my strategies to adapt to market shifts. If you’re interested in trading insights or strategies, you’ve come to the right place!