ICT Optimal Trade Entry (OTE) Fib Levels and Settings
Optimal Trade Entry (ICT OTE) refers to Fibonacci retracement levels traders use to enter long or short positions. These levels, calculated using Fibonacci ratios (e.g., 61.8%, 50%, and 38.2%), help identify strategic price points in a trending market.
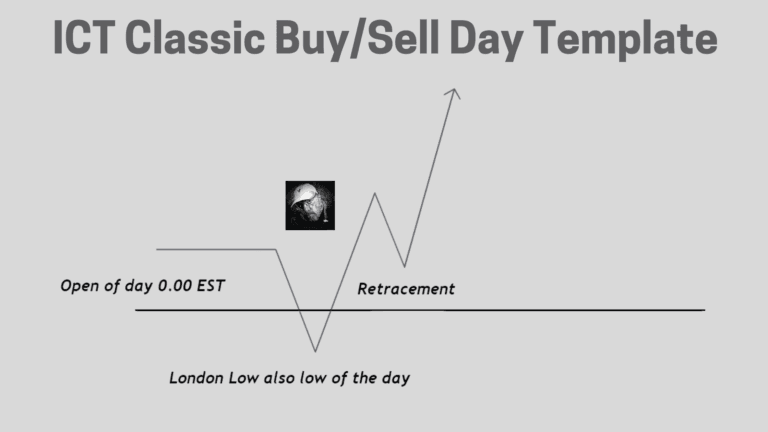
Markets exhibit cyclical behavior, alternating between upward (bullish) and downward (bearish) movements.
Why Are Fibonacci Levels Important in a Trending Market?
- Strategic Entries: Fibonacci levels allow traders to pinpoint ideal entry points during retracements.
- Risk Management: They assist in setting stop-loss levels below or above key Fibonacci ratios.
- Trend Validation: Price reaction at these levels confirms the trend’s strength or potential reversal
ICT Bullish OTE Example
The below EURUSD chart explain the EURUSD Bullish OTE setup.
In a bullish trend, the EUR/USD pair showed significant upward momentum by breaking the previous high at 1.07612 and forming a new high at 1.07751 as shown in below chart. This confirmed a strong bullish sentiment in the market.
To analyze potential retracement levels for a long entry, the Fibonacci retracement tool was applied from the swing low at 1.06660 to the swing high at 1.07751. This highlighted key retracement levels:
- 38.2% at approximately 1.07299,
- 50% at 1.07205,
- 61.8% at 1.07112.
The price retraced to 1.07104, aligning closely with the 61.8% Fibonacci level. This level provided a high-probability zone for executing a long position, as the retracement suggested a continuation of the bullish trend.
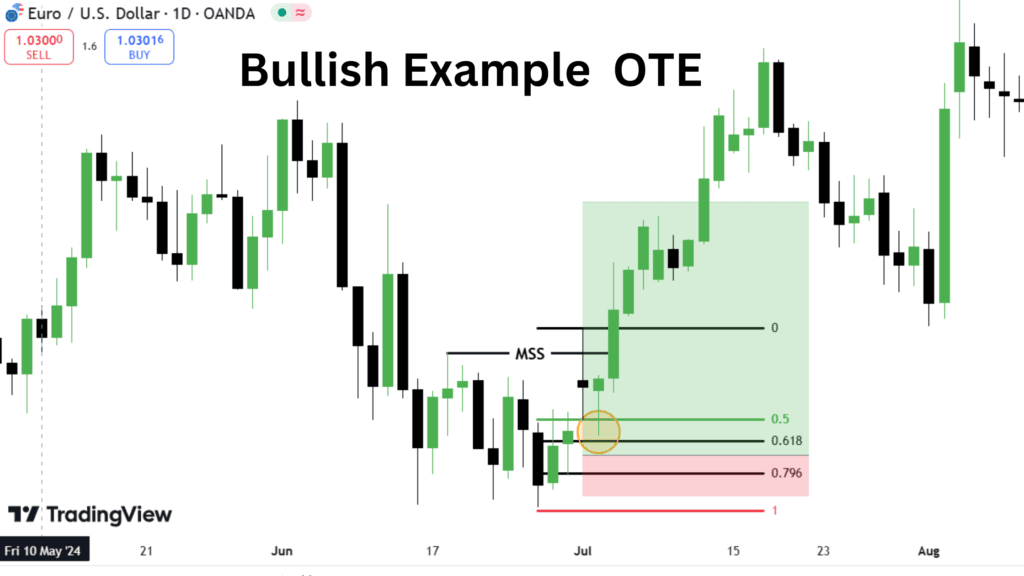
This trade setup included:
- Entry Point: Positioned at 1.07104, where the retracement stabilized.
- Stop Loss: Placed at 1.06723, slightly below the swing low to protect against adverse price movements.
- Take Profit Target: Set at 1.08512, targeting the next significant resistance zone, ensuring a favorable risk-to-reward ratio.
This trade aimed to capitalize on the market’s bullish structure while managing risk effectively by utilizing Fibonacci retracement levels for precise execution.
ICT Bearish BTCUSDT OTE Example
In a bearish trend, the GBP/USD pair exhibited downward momentum by breaking the previous low at 1.28583 and creating a new low at 1.28475. This confirmed a strong bearish sentiment.
After forming the new low, the price retraced upward to 1.30106, signaling a potential short-selling opportunity upon reaching a resistance zone. The retracement aligned with a critical area for executing sell trades, offering a high-probability setup to capitalize on the bearish trend.
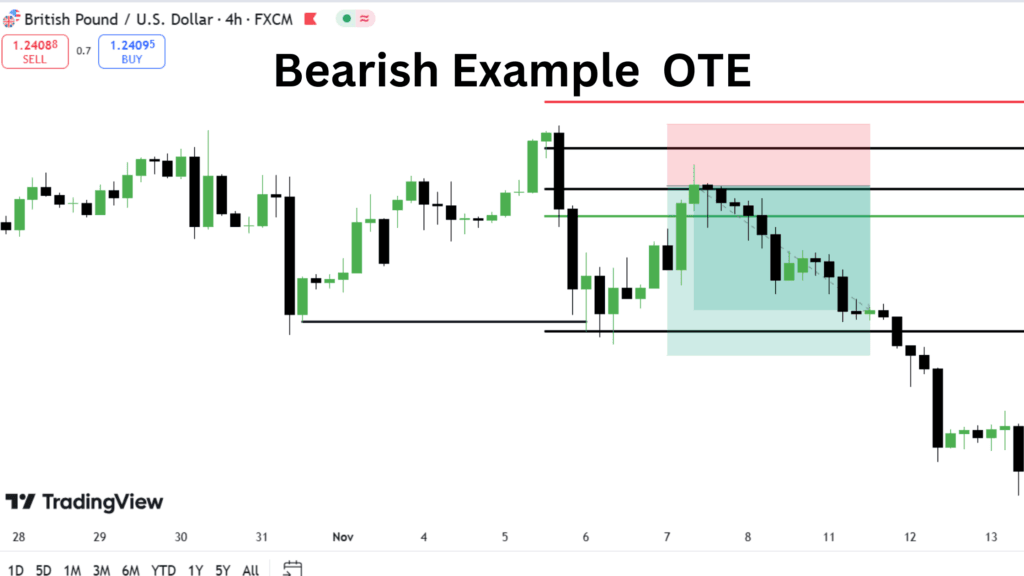
The trade setup parameters are as follows:
- Entry Point: At 1.29911, positioned within the retracement zone as the price began to reverse downward.
- Stop Loss: Placed at 1.30487, just above the resistance level to protect against unexpected price spikes.
- Take Profit Target: Set at 1.28319, targeting a level below the previous low to maximize profit potential in line with the bearish continuation.
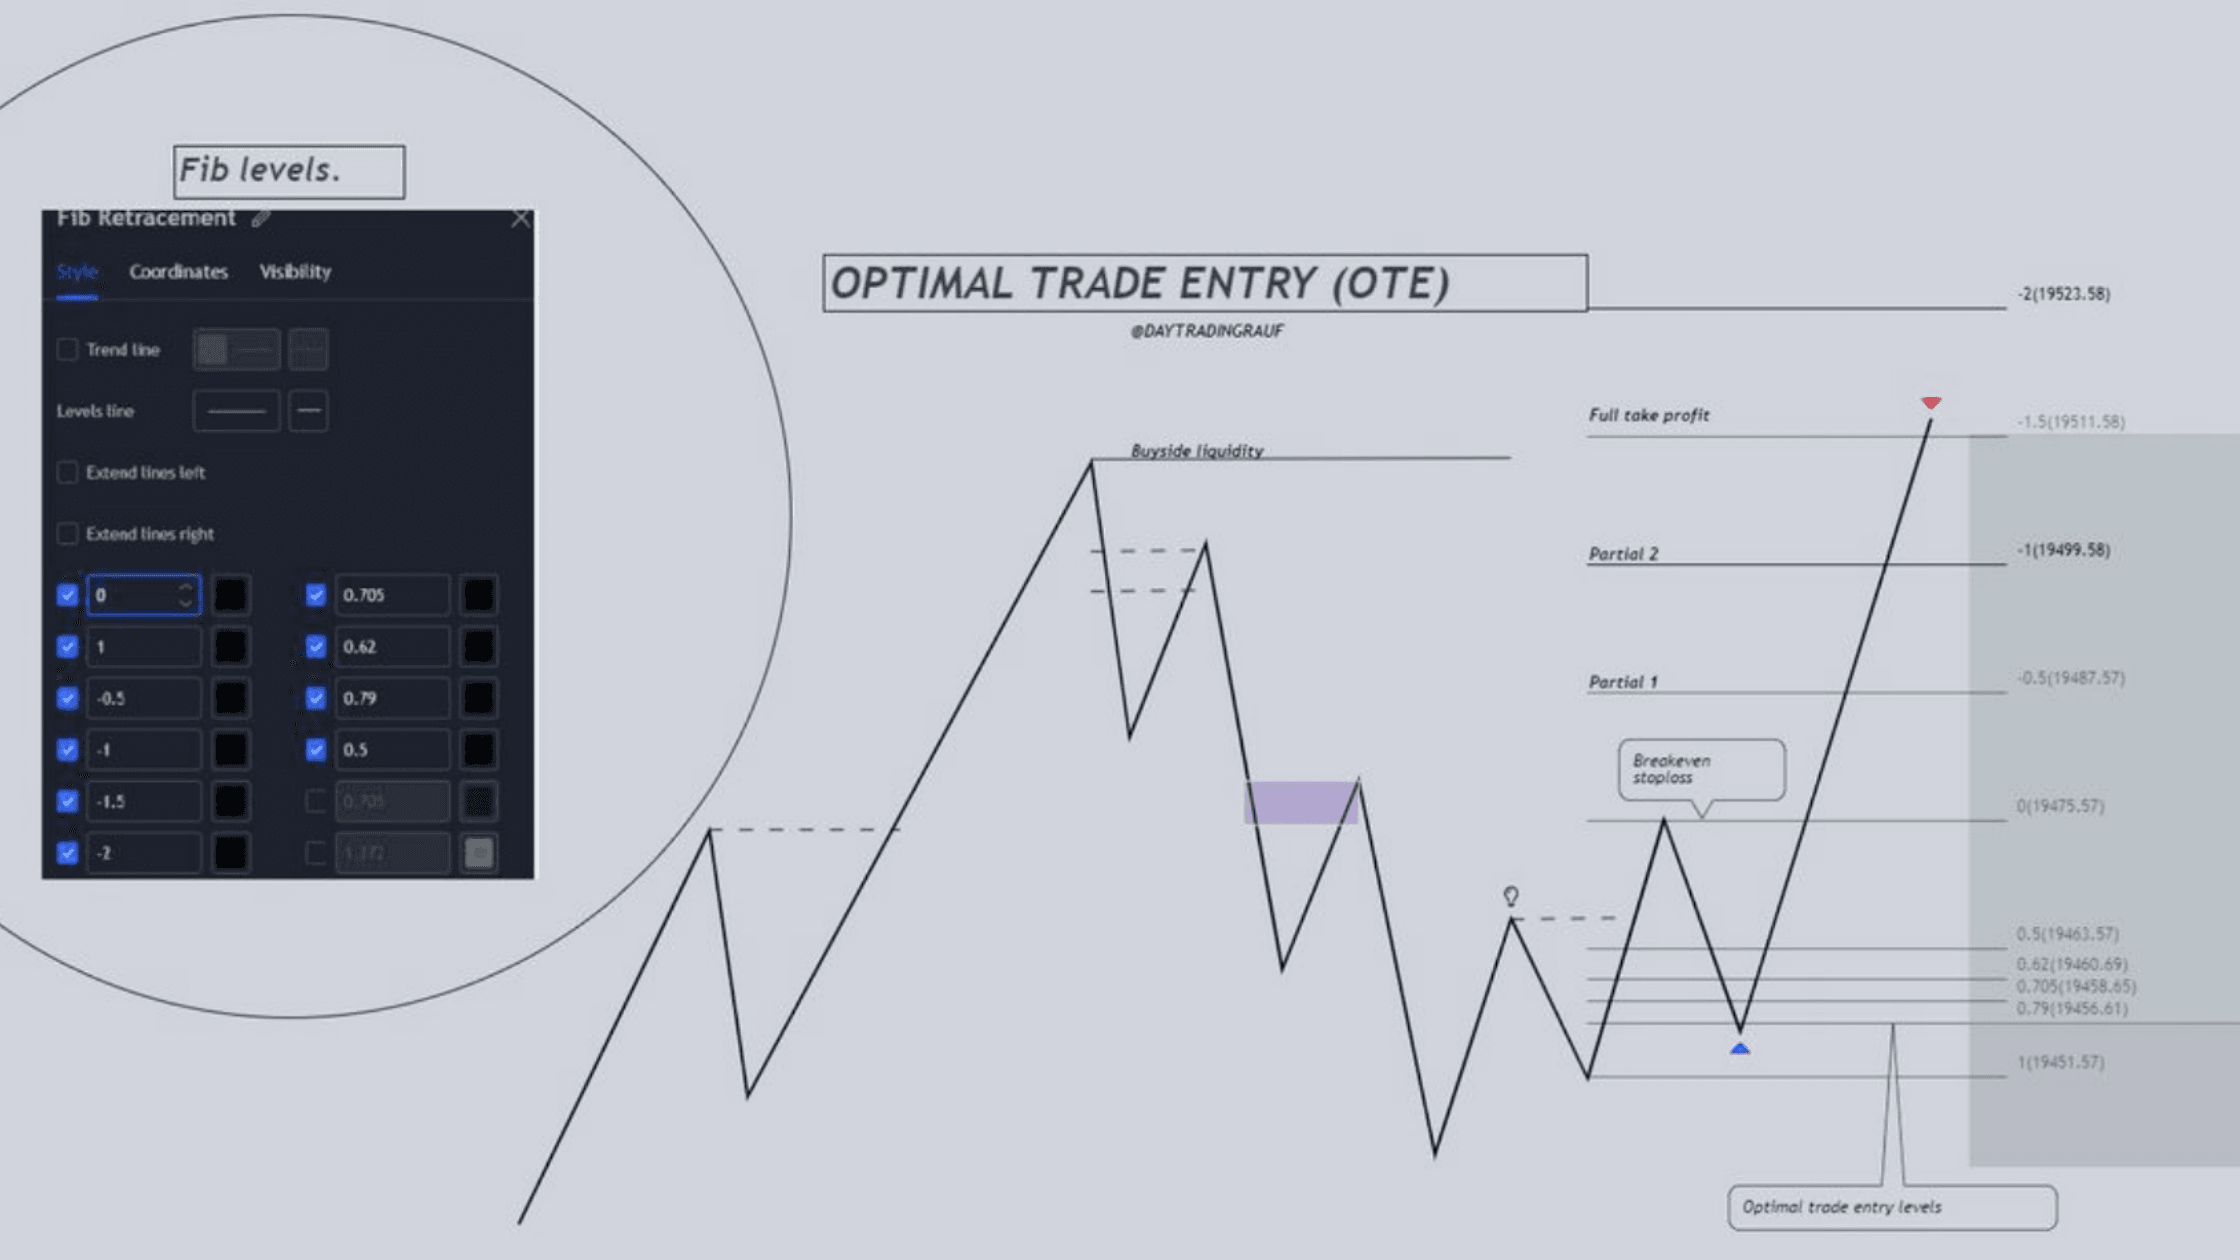
Important ICT OTE Levels
ICT Optimal Trade Entry (OTE) patterns are specific Fibonacci levels. In a trending market, the price respects these levels, providing traders with opportunities to execute their trades.
Fibonacci Retracement Levels
| Level | Description |
|---|---|
| 0 | First Profit Scale |
| 0.5 | Equilibrium (OTE Zone) |
| 0.618 | Golden Zone (OTE Zone) |
| 0.705 | OTE |
| 0.786 | Golden Zone (OTE Zone) |
| 1 | Starting Position |
| -0.5 | Target 1 |
OTE Zones
The Optimal Trade Entry (OTE) zone uses specific Fibonacci retracement levels to identify good trading opportunities.
- OTE Levels: The main optimal trade entry levels are 0.5, 0.618, and 0.786.
- Golden Zones: The 0.618 and 0.786 levels are called golden zones most of the time market respects these levels.
- Best Risk to Reward: Executing trades when the price retraces to these levels typically offers the best risk-to-reward ratio.
How to Set OTE Levels on Chart
To set up Fibonacci retracement levels in TradingView, start by opening the platform and selecting your desired chart. Next, access the Fibonacci Retracement tool from the left-hand toolbar.
To draw the Fibonacci levels, identify the relevant price points. For an upward retracement, click at the swing low and drag the tool to the swing high. For a downward retracement, reverse the direction, dragging from the swing high to the swing low.
Once placed, fine-tune the levels by double-clicking on the Fibonacci tool to open its Settings. In the settings panel, customize the levels by adding or modifying them as follows:
- 0: Represents the initial profit-taking scale.
- 0.5: Indicates the equilibrium level.
- 0.618: Marks the golden zone, a key retracement level.
- 0.705: Represents the Optimal Trade Entry (OTE).
- 0.786: Another level within the golden zone.
- 1: Denotes the starting position.
- -0.5: Used to mark the first target level.
After entering the desired levels, click “OK” to apply the changes. This setup will display Fibonacci retracement zones on your chart, helping you identify key entry and exit points for trading.

Hi, I’m Seojin Lee, an experienced trader focusing on the U.S. stock market, particularly NASDAQ and E-mini S&P futures. As a Chartered Financial Analyst (CFA), I apply my knowledge of financial analysis and market strategies to identify profitable opportunities.
I specialize in both short-term and long-term trading, always balancing risk management with market trends. With years of experience, I continuously refine my strategies to adapt to market shifts. If you’re interested in trading insights or strategies, you’ve come to the right place!