Internal Range Liquidity (IRL) and External Range Liquidity (ERL) are cornerstone concepts in building a trading framework based on ICT (Inner Circle Trader) liquidity principles. These concepts offer a comprehensive understanding of market dynamics by revealing where price originates and its likely destination.
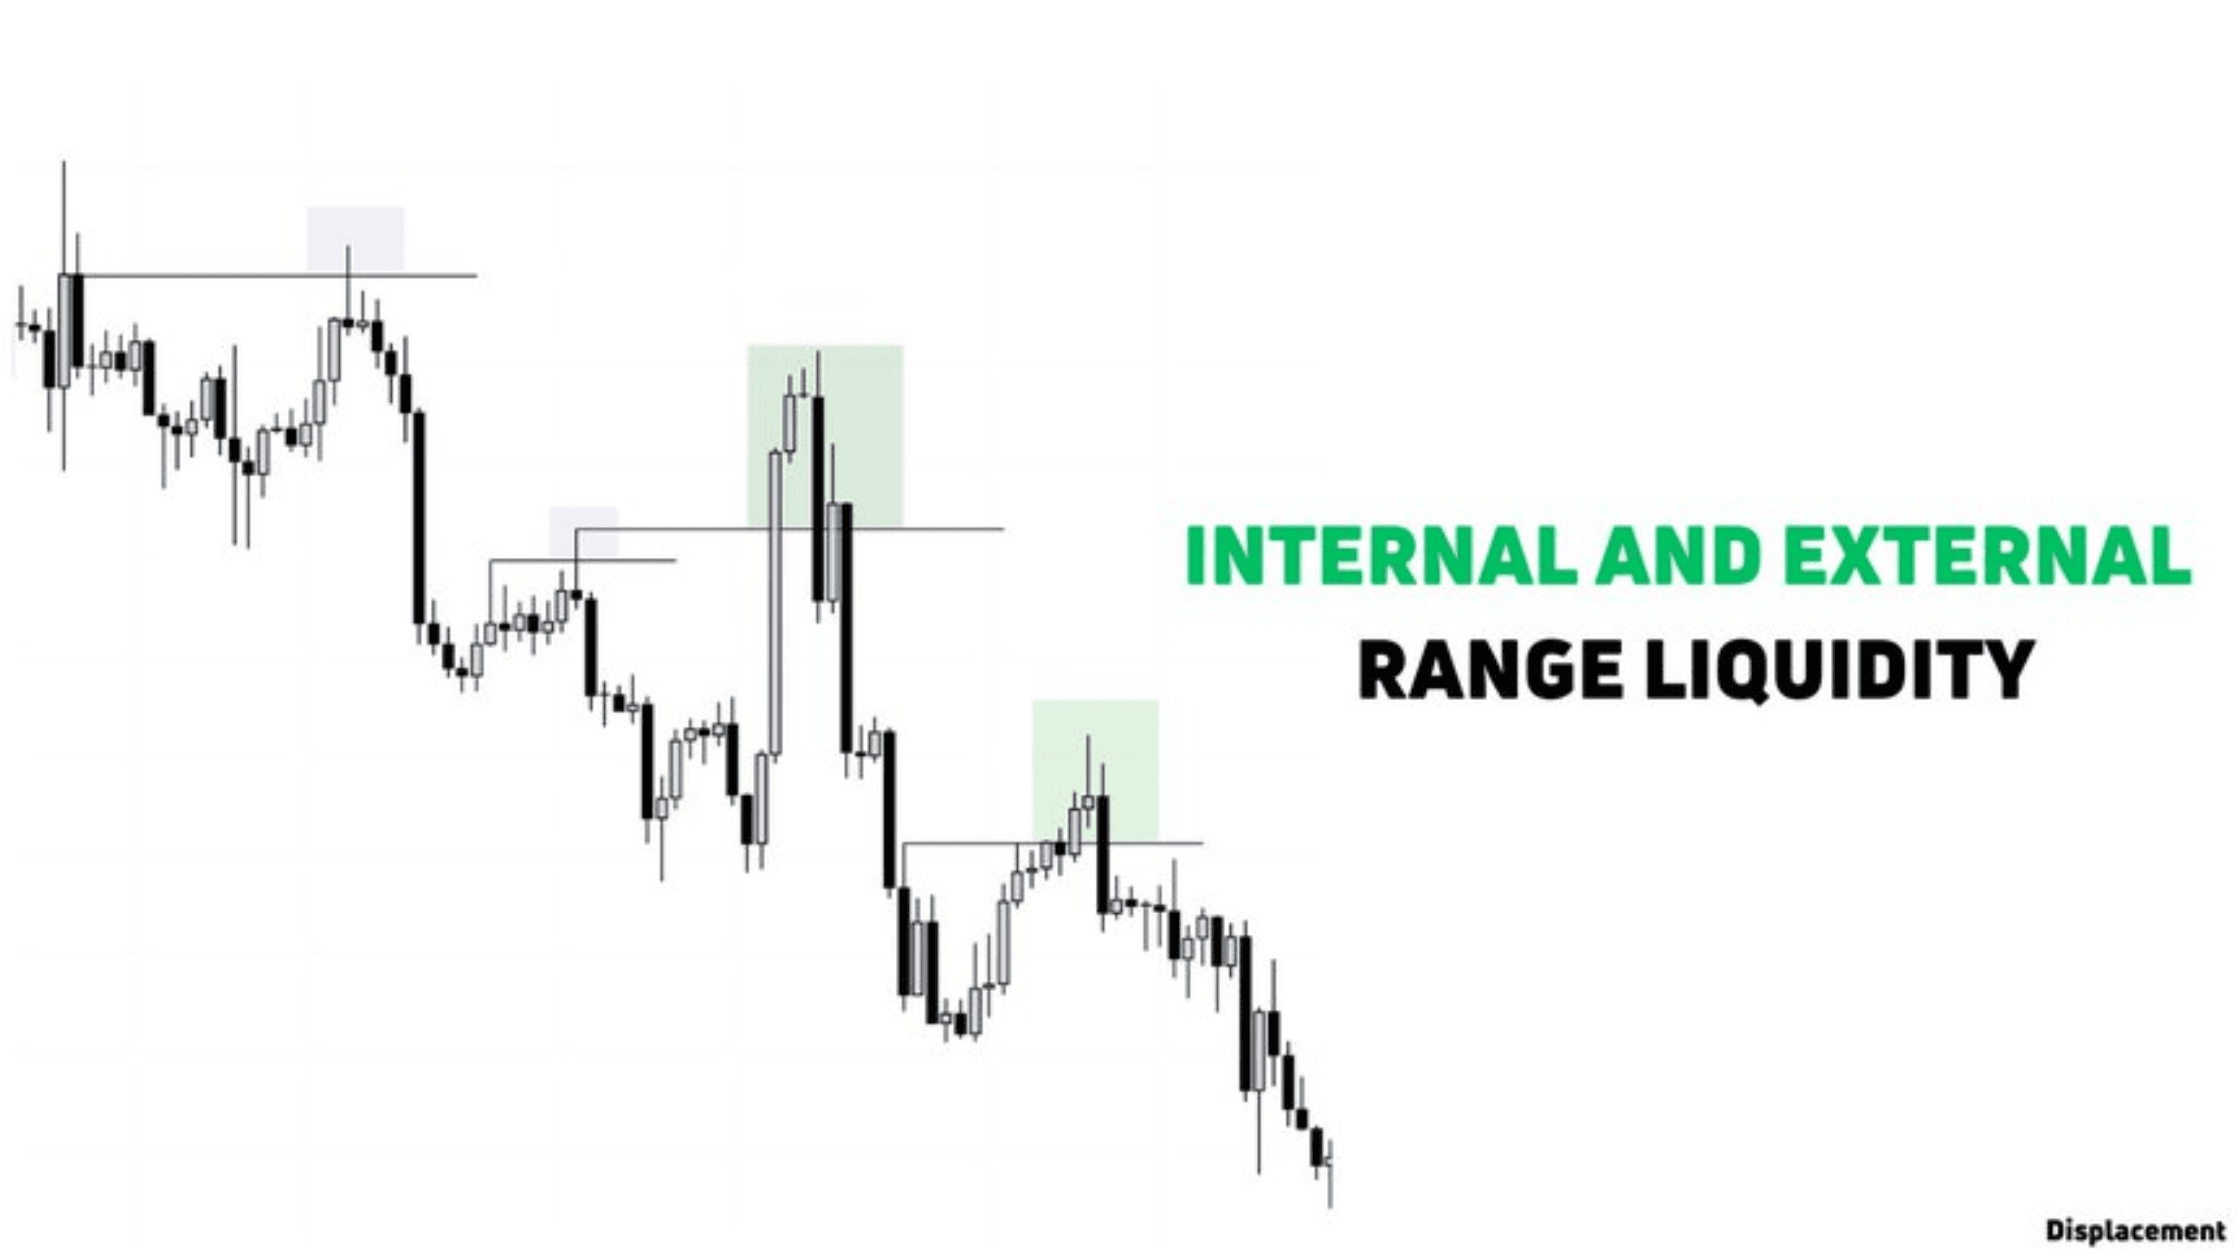
Understanding IRL and ERL allows traders to map the flow of price action systematically. When the market sweeps External Range Liquidity—the liquidity resting above swing highs or below swing lows—it often targets Internal Range Liquidity zones next, such as order blocks or fair value gaps. Similarly, after interacting with IRL, price typically moves toward the nearest ERL.
What is Internal Range Liquidity (IRL)
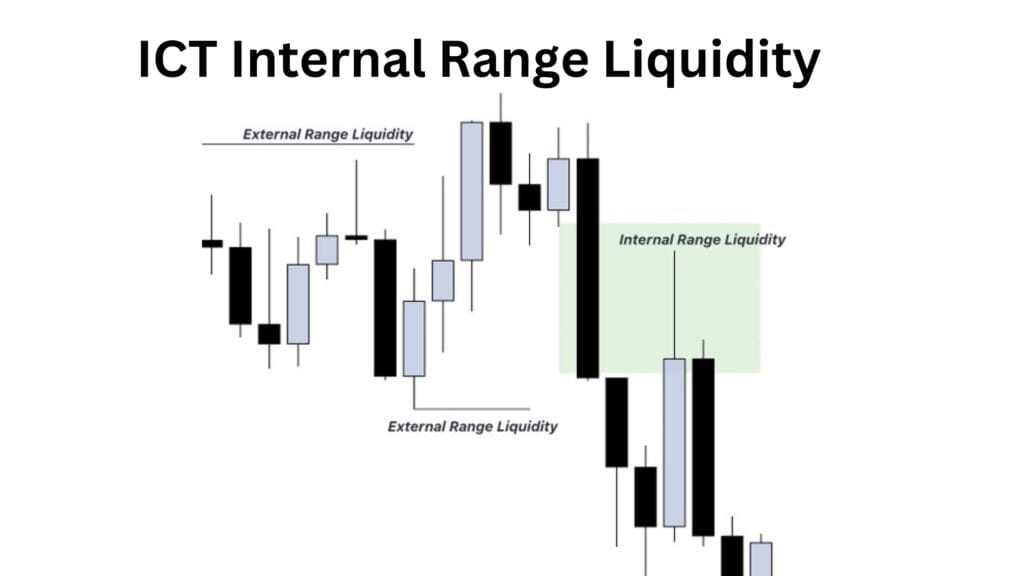
ICT Internal Range Liquidity (IRL) refers to the liquidity located within a defined price range, such as a consolidation zone, order block, or fair value gap. These areas contain unfilled orders or resting liquidity where price often pauses, rebalances, or reverses.
You can find ICT IRL in the form

What is ICT External Range Liquidity ERL
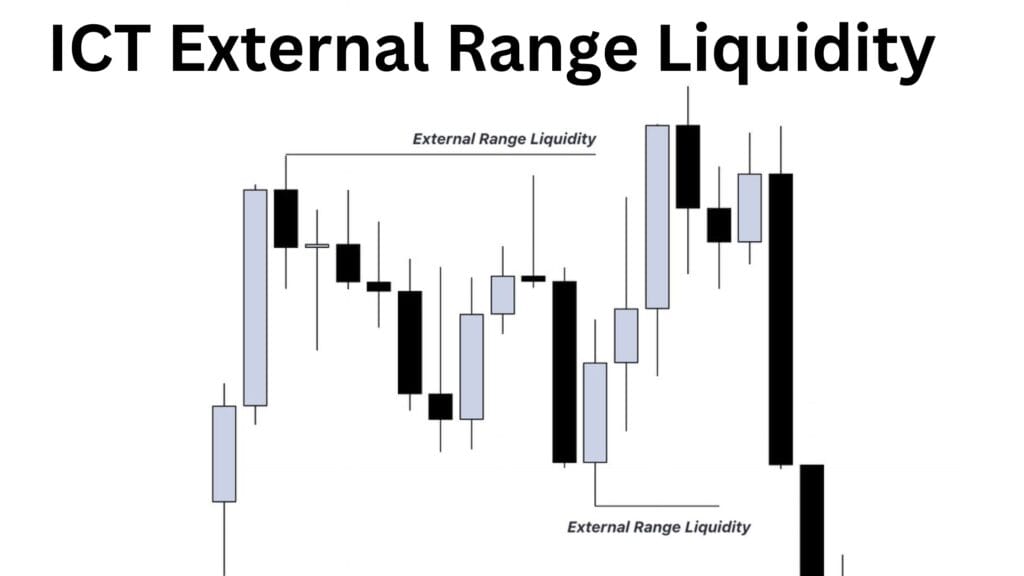
ICT External Range Liquidity (ERL) refers to the liquidity residing outside a defined dealing range, specifically above significant swing highs or below swing lows. These areas contain stop orders and pending trades, making them prime targets for price movement.
Where ERL Reside
ERL can be found above the old highs and below the old lows. Market can often reserve their direction when sweeping ERL liquidity.

IRL and ERL Trading Strategy
Trading using Internal Range Liquidity (IRL) and External Range Liquidity (ERL) involves leveraging the natural flow of price as it alternates between these two liquidity zones. This strategy is highly effective in trending and ranging markets, aligning trades with liquidity dynamics.
Price Movement Principal
- From ERL to IRL
- From IRL to ERL
Refer to the images below of the AUD/USD pair for a clearer understanding of External Range Liquidity and Internal Range Liquidity. It is clear from the below chart price sweep the external liquidity (sell side) and Fair Value Gap is present in the form of IRL.

Price comeback to fill the internal range liquidity or a gap present in the form of FVG

Now its next target is external range liquidity

Learn more Liquidity and check these resources
What is sell-side and buy-side Liquidity.


