What is Interbank Price Delivery Algorithm (IPDA) and Data Ranges?
The Interbank Price Delivery Algorithm (IPDA) is a theoretical framework used to understand how institutional markets deliver price by seeking liquidity and rebalancing inefficiencies. It emphasizes the role of liquidity pools (Buy-Side and Sell-Side) and Fair Value Gaps (FVGs) in driving price movements. IPDA helps traders align with institutional order flow for precise market analysis.
What is IPDA?
The Interbank Price Delivery Algorithm governs how price moves in the financial markets. It’s the backbone of market behavior, dictating the four main phases:
- Consolidation
- Expansion
- Retracement
- Reversal
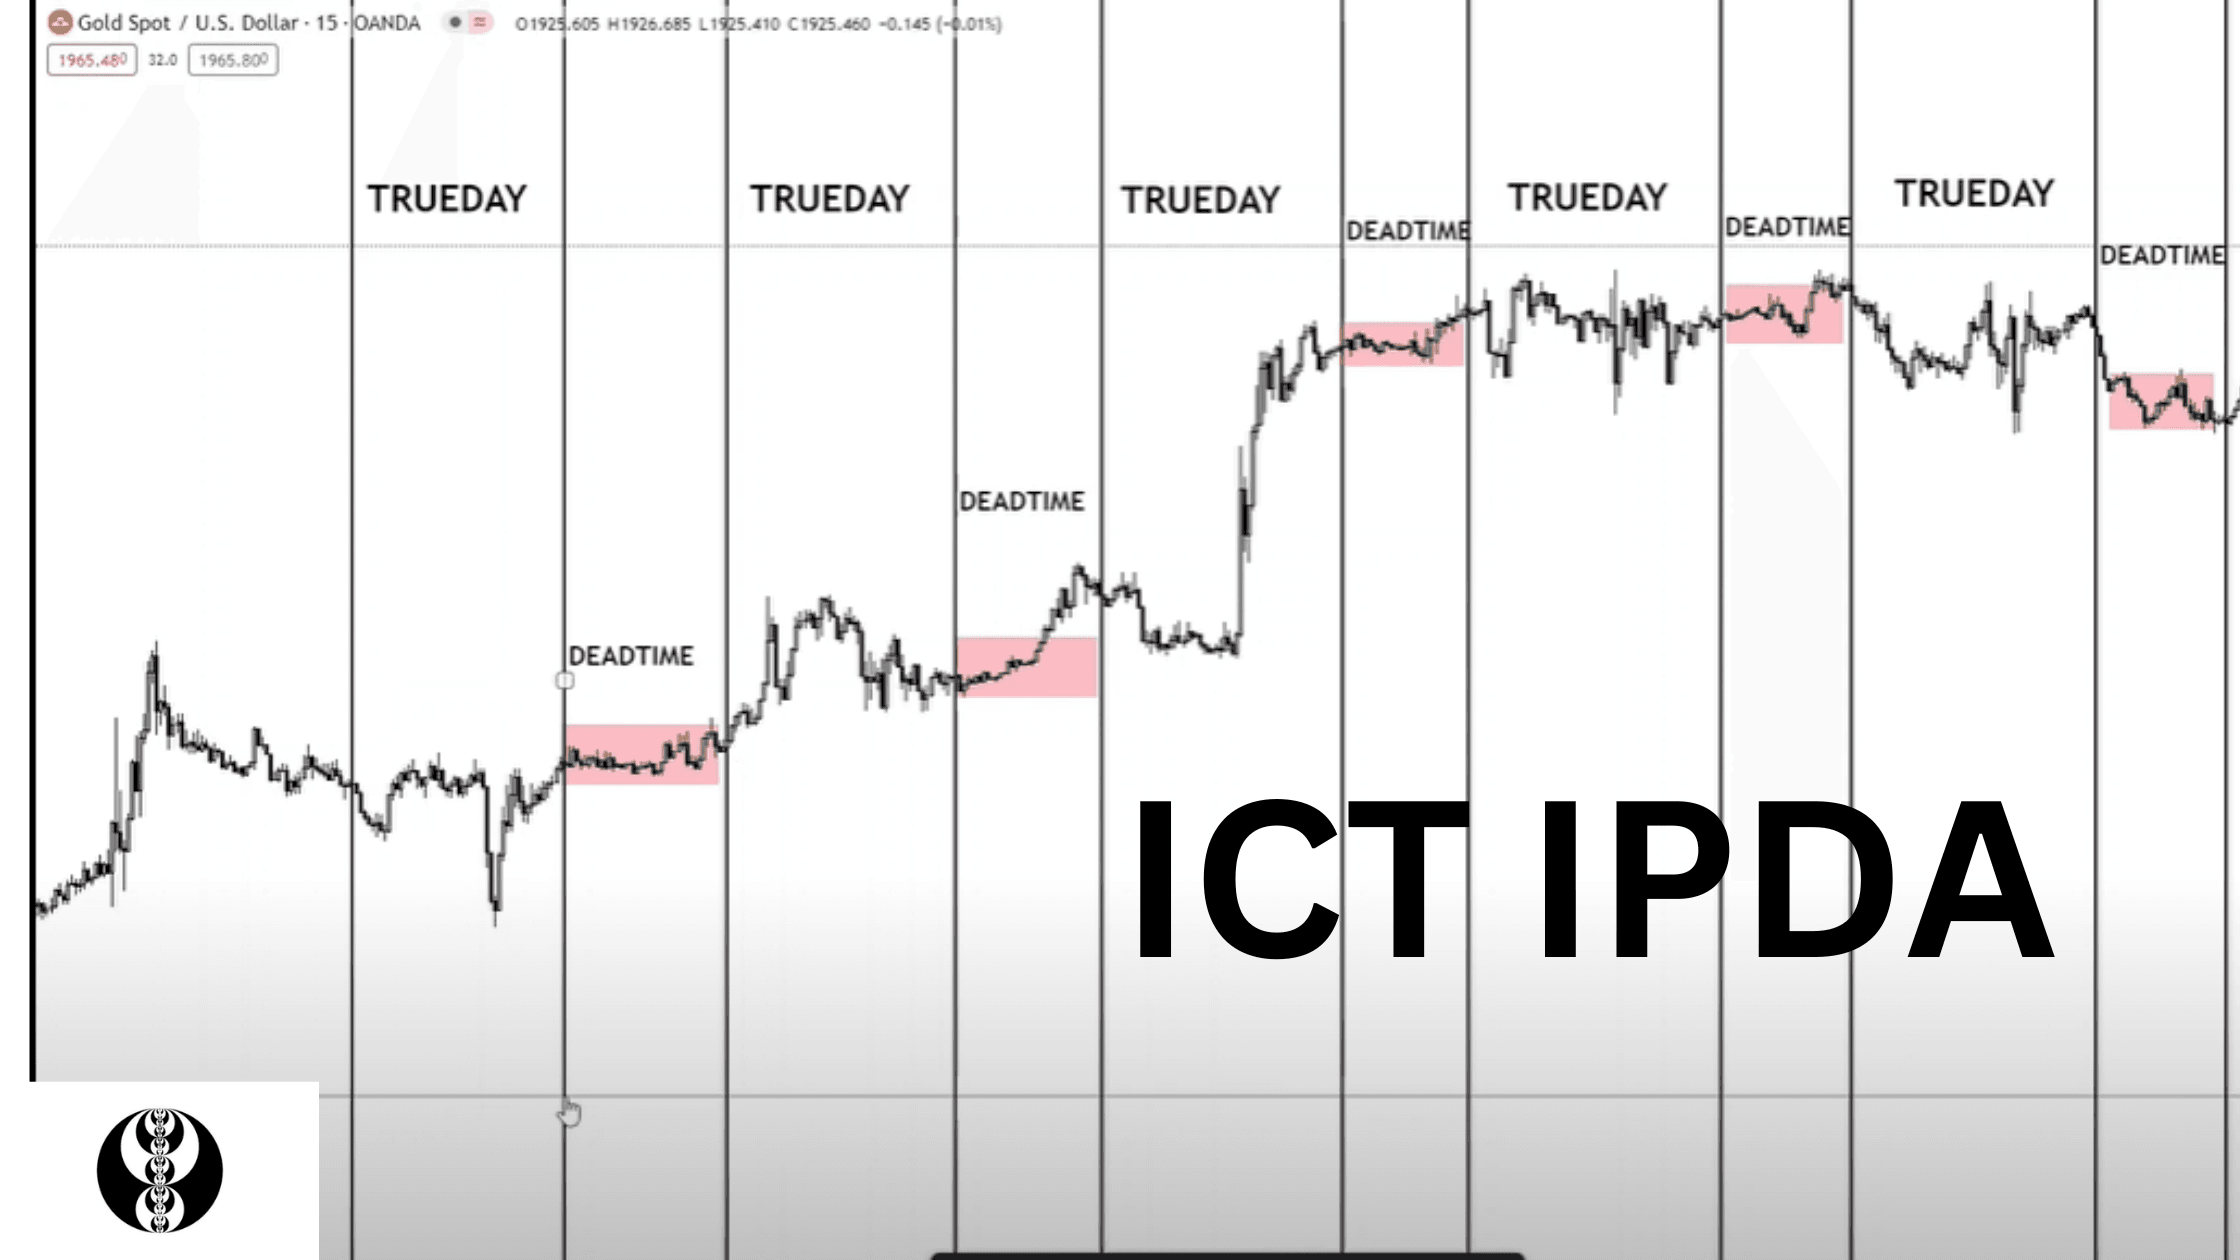
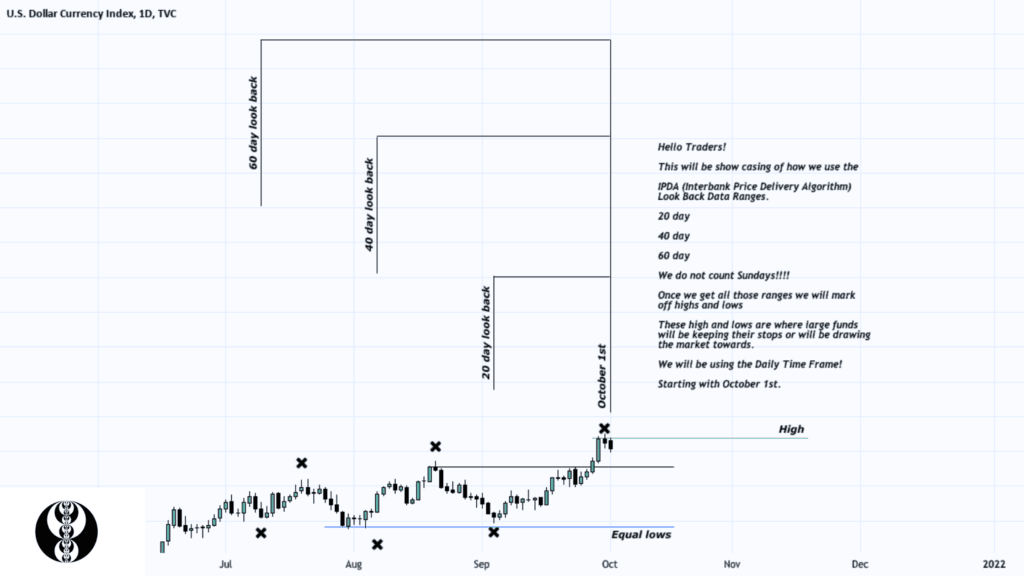
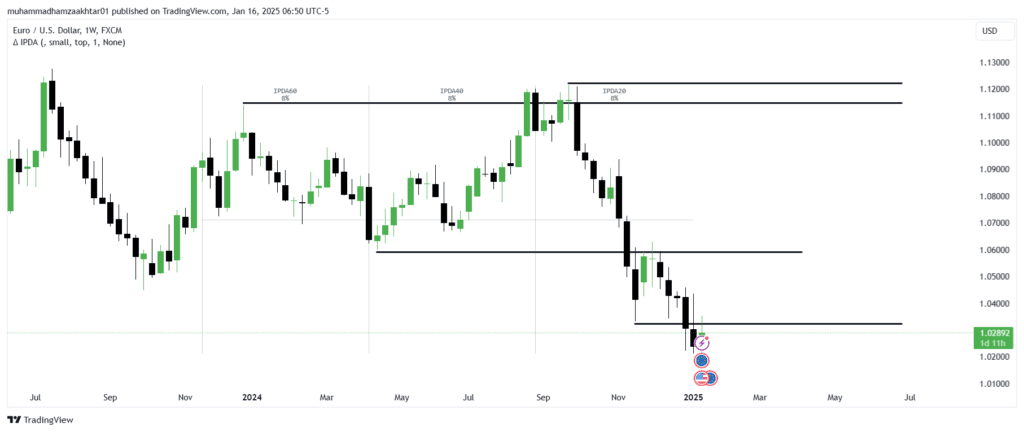
What are IPDA Data Ranges?
IPDA operates based on look-back periods of 20, 40, and 60 trading days, allowing traders to analyze liquidity and predict price movements. These ranges reveal the highest highs and lowest lows within their respective periods, which act as critical levels where liquidity resides.
Key Look-Back Periods:
- 20 Trading Days: Short-term liquidity insights.
- 40 Trading Days: Medium-term trends and liquidity zones.
- 60 Trading Days: Long-term trends and potential quarterly shifts.
What is the ICT Quarterly Shift Theory?
The ICT IPDA Quarterly Shift Theory explains how price trends in financial markets often shift every three to four months. This understanding is fundamental to predicting market behavior under the Interbank Price Delivery Algorithm (IPDA).
The core idea behind this theory is that financial markets do not maintain a continuous bullish or bearish trend throughout the year. Instead, they exhibit significant shifts approximately every 90 to 120 days (3 to 4 months). These shifts align with quarterly cycles often driven by institutional activity, macroeconomic data, and liquidity distribution.
IPDA Trading Strategy
At the start of every new trading month, mark the highs and lows of the previous 20, 40, and 60 days. These levels represent areas of significant liquidity, where large institutional orders are often placed. These zones help identify key Buy-Side Liquidity (above recent highs) and Sell-Side Liquidity (below recent lows).
At the start of every new trading month, mark the highs and lows of the previous 20, 40, and 60 days. These levels represent areas of significant liquidity, where large institutional orders are often placed. These zones help identify key Buy-Side Liquidity (above recent highs) and Sell-Side Liquidity (below recent lows).
- If price sweeps Sell-Side Liquidity (SSL), it indicates that the market has targeted stop-loss orders below support.
- Post-sweep, the next target is Buy-Side Liquidity (BSL), typically above resistance or prior highs.
- Conversely, if Buy-Side Liquidity is swept first, expect price to shift toward Sell-Side Liquidity.
Execution
Entry: After a liquidity sweep (e.g., SSL), enter on a retracement to a key level, such as an FVG or equilibrium (50% of the sweep range).
Stop Loss: Place stops below/above the liquidity sweep.
Target: Set your target at the next liquidity pool (e.g., BSL or SSL).

Hi, I’m Seojin Lee, an experienced trader focusing on the U.S. stock market, particularly NASDAQ and E-mini S&P futures. As a Chartered Financial Analyst (CFA), I apply my knowledge of financial analysis and market strategies to identify profitable opportunities.
I specialize in both short-term and long-term trading, always balancing risk management with market trends. With years of experience, I continuously refine my strategies to adapt to market shifts. If you’re interested in trading insights or strategies, you’ve come to the right place!